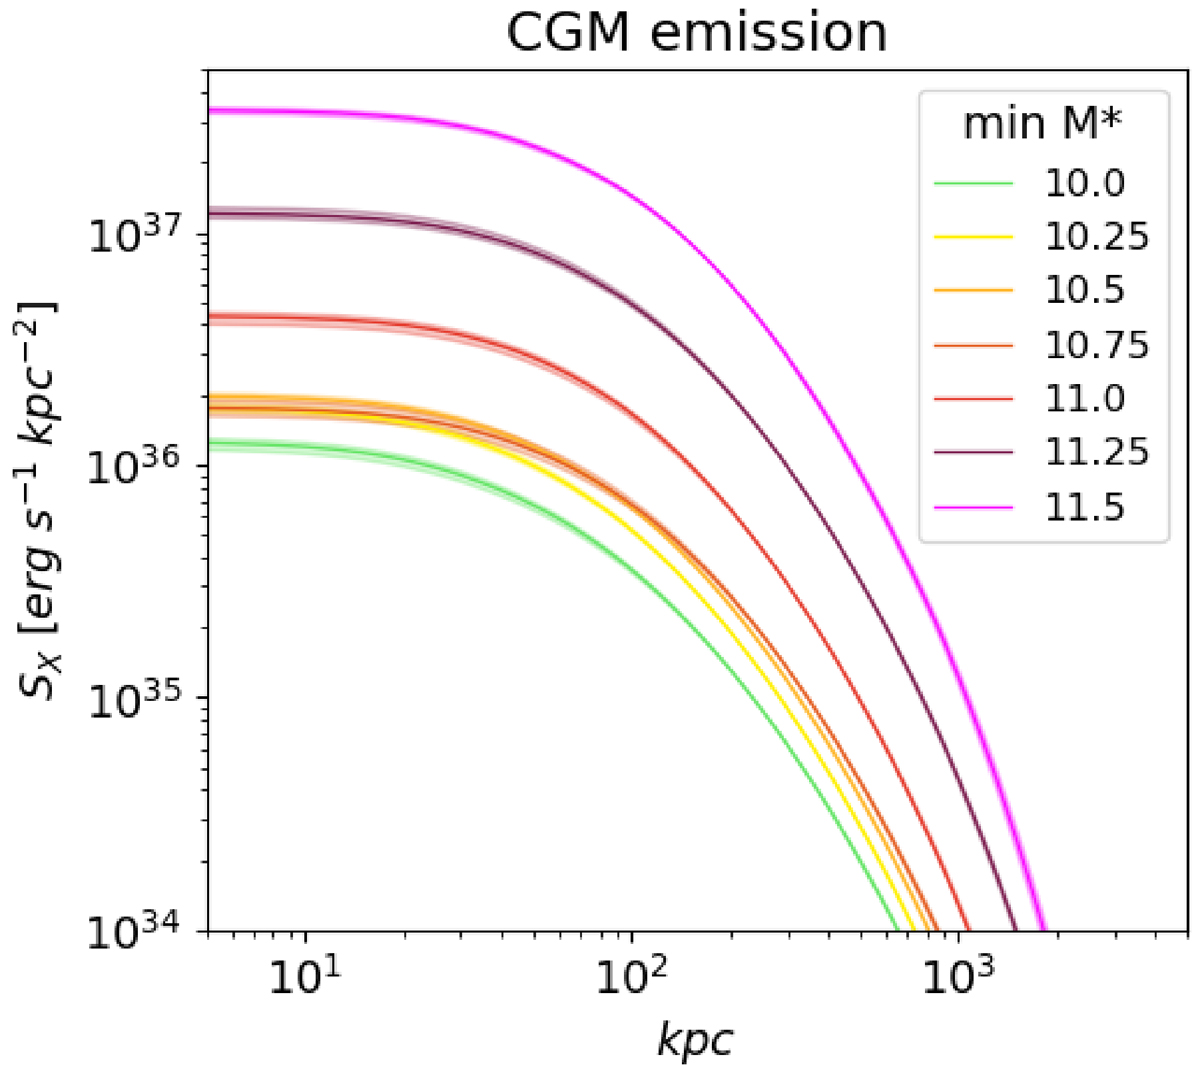
Fig. 12.
Download original image
Comparison of average hot gas surface brightness profiles (cross-correlation between events and central galaxies) inferred with the model for each sample. The differently colored, shaded areas represent different samples, identified here by the logarithm of their minimum stellar mass, in solar masses following the color scheme of Fig. 1. This emission average is made over a large range of halo masses. The average emission increases with the stellar mass threshold. We decompose the average emission as a function of halo mass in Fig. 13 (see top row).
Current usage metrics show cumulative count of Article Views (full-text article views including HTML views, PDF and ePub downloads, according to the available data) and Abstracts Views on Vision4Press platform.
Data correspond to usage on the plateform after 2015. The current usage metrics is available 48-96 hours after online publication and is updated daily on week days.
Initial download of the metrics may take a while.