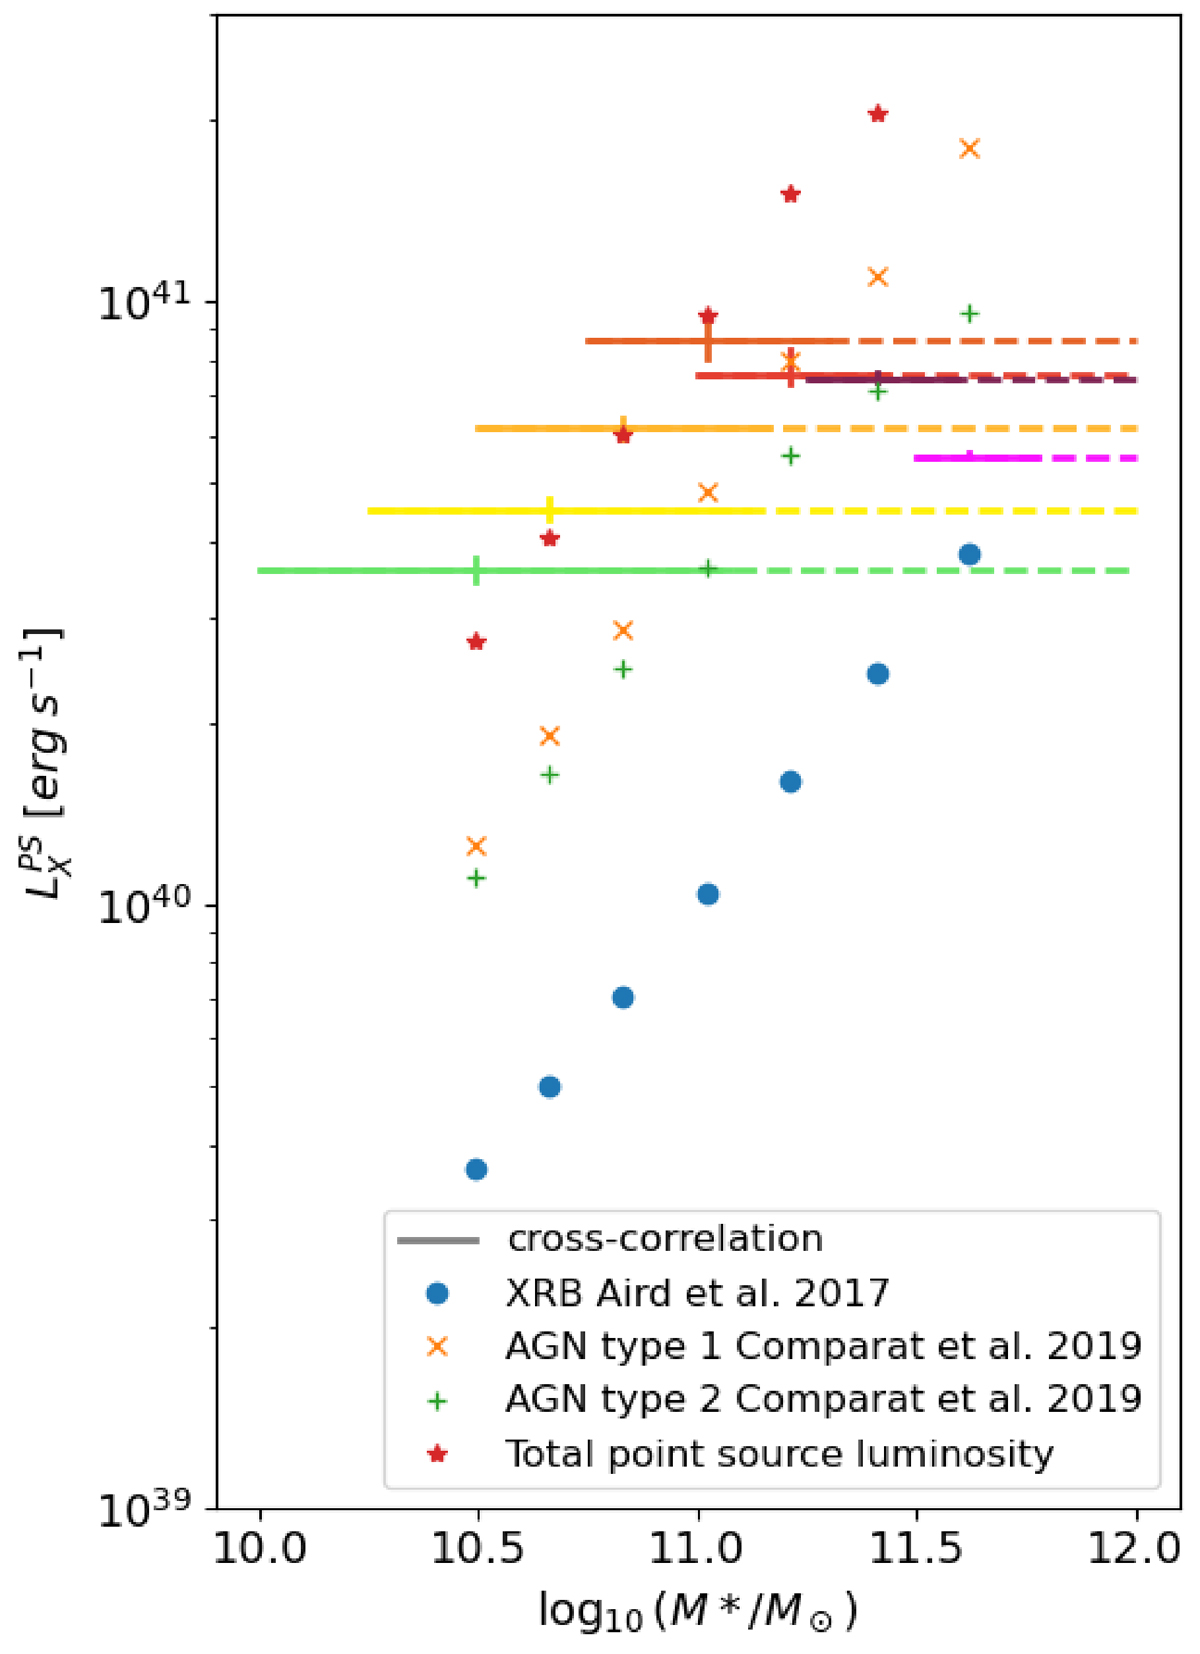
Fig. 11.
Download original image
Comparison of the average point source emission components obtained for each sample as a function of the stellar mass. The horizontal solid line represents the mean and standard deviation of the stellar masses in the samples. The horizontal dashes show the extent of the selection. Different colored crosses represent different samples, identified here by the logarithm of their minimum stellar mass, in solar masses following the color scheme of Fig. 1. The inferred average point source luminosity increases with mean stellar mass from log10(M * /M⊙) = 10.6 until 11 and stalls, then decreases slightly. The point source luminosities in each sample are consistently more luminous than the predicted XRB luminosity for each sample using Aird et al. (2017). The predicted AGN luminosities from the Comparat et al. (2019) model for type 1 (orange crosses) and type 2 (green pluses) are lower than the observations for the thresholds 10, 10.25, 10.5, 10.75, but they then are higher for the thresholds 11, 11.25 and 11.5. The total predicted luminosity in point sources (red stars) with these models agrees with the observations only for three samples (10.25, 10.5, 10.75 selections) out of seven. These inferred quantities will be used as a benchmark to test upcoming AGN models in the large-scale structure, for example to test mechanisms of X-ray AGN suppression in high halo mass (e.g., Muñoz Rodríguez et al. 2024).
Current usage metrics show cumulative count of Article Views (full-text article views including HTML views, PDF and ePub downloads, according to the available data) and Abstracts Views on Vision4Press platform.
Data correspond to usage on the plateform after 2015. The current usage metrics is available 48-96 hours after online publication and is updated daily on week days.
Initial download of the metrics may take a while.