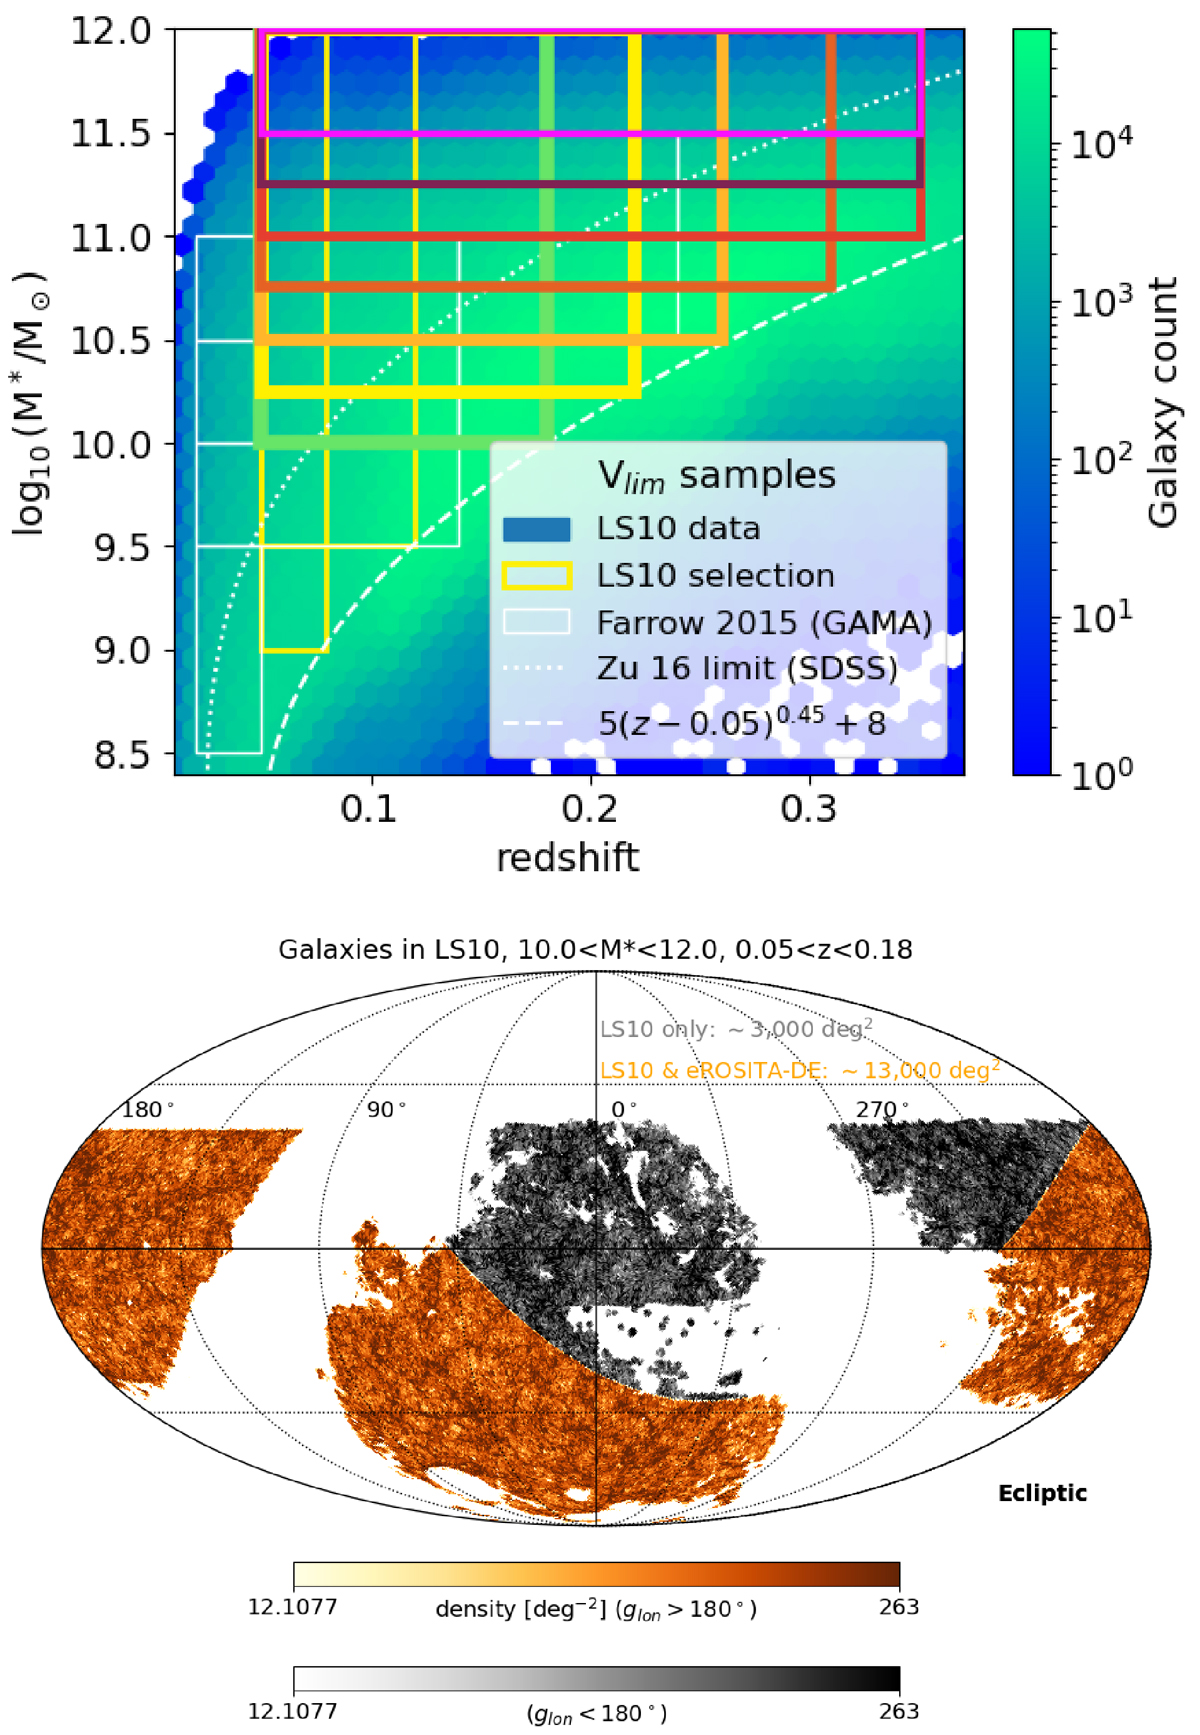
Fig. 1.
Download original image
Top: Sample definitions in the redshift-stellar mass plane. In the analysis, we considered the samples encompassed by the colored boxes. The white boxes depict previously defined SDSS and GAMA-based galaxy samples (Farrow et al. 2015; Zu & Mandelbaum 2016). The line log10(M * ) = 5(z − 0.05)0.45 + 8 corresponds to the volume limit used in this work. The colorbar depicts the number of galaxies in hexagonal (for better visualization) bins. Bottom: Area covered by the sample with log10(M*/M⊙) > 10 and 0.05 < z < 0.18. The filamentary nature of the large-scale structure is visible. The orange (grey) area is (not) included in the eROSITA_DE footprint.
Current usage metrics show cumulative count of Article Views (full-text article views including HTML views, PDF and ePub downloads, according to the available data) and Abstracts Views on Vision4Press platform.
Data correspond to usage on the plateform after 2015. The current usage metrics is available 48-96 hours after online publication and is updated daily on week days.
Initial download of the metrics may take a while.