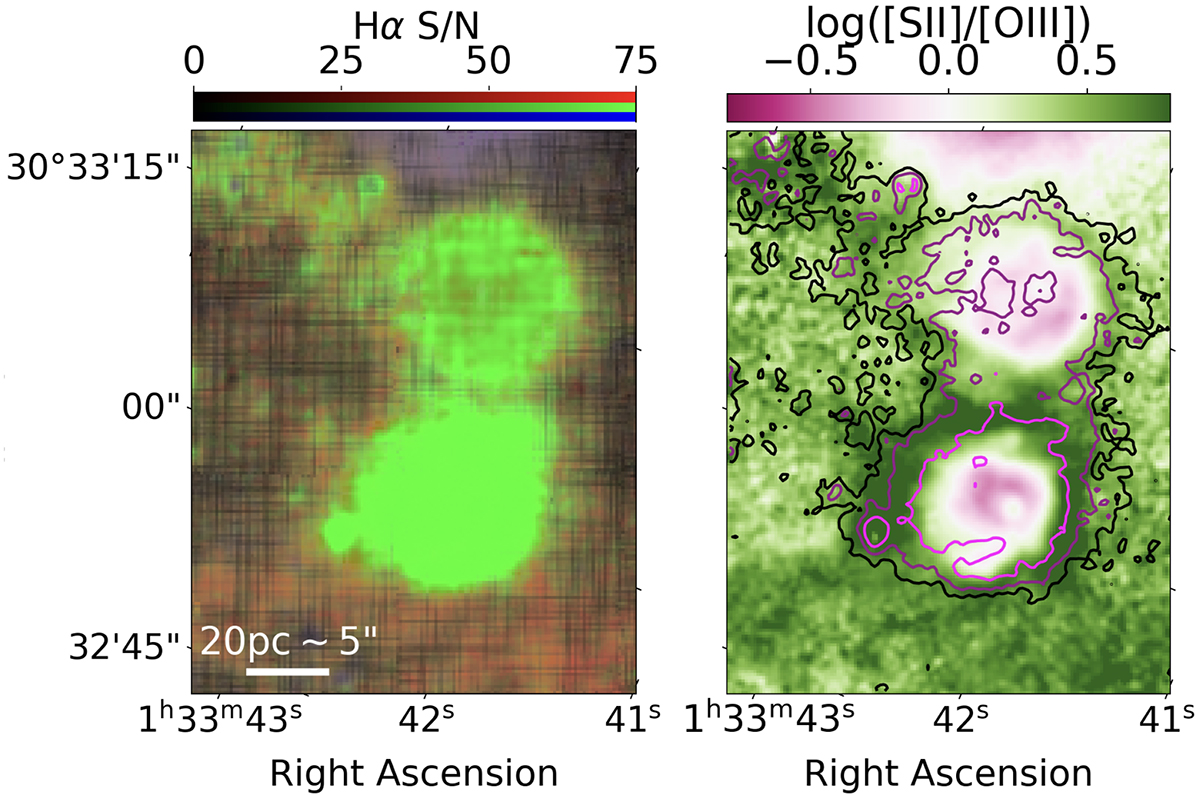
Fig. 6.
Download original image
Zoom-in of a region of interest in the M33 field, focusing on two H II regions. In the left classification map, we quantitatively represent the predicted contribution to each pixel’s spectra from an H II region in green, a PN in blue, and a SNR/DIG in red. We overlay a S/N map (in shades of grey), derived from the Hα flux map and its associated error map. The right panel shows a [S II]λ6716, 6731/[O III]λ5007 ratio map. The black, purple, and magenta contours in this panel enclose a model-predicted H II region probability of 0.4, 0.6, and 0.9, respectively.
Current usage metrics show cumulative count of Article Views (full-text article views including HTML views, PDF and ePub downloads, according to the available data) and Abstracts Views on Vision4Press platform.
Data correspond to usage on the plateform after 2015. The current usage metrics is available 48-96 hours after online publication and is updated daily on week days.
Initial download of the metrics may take a while.