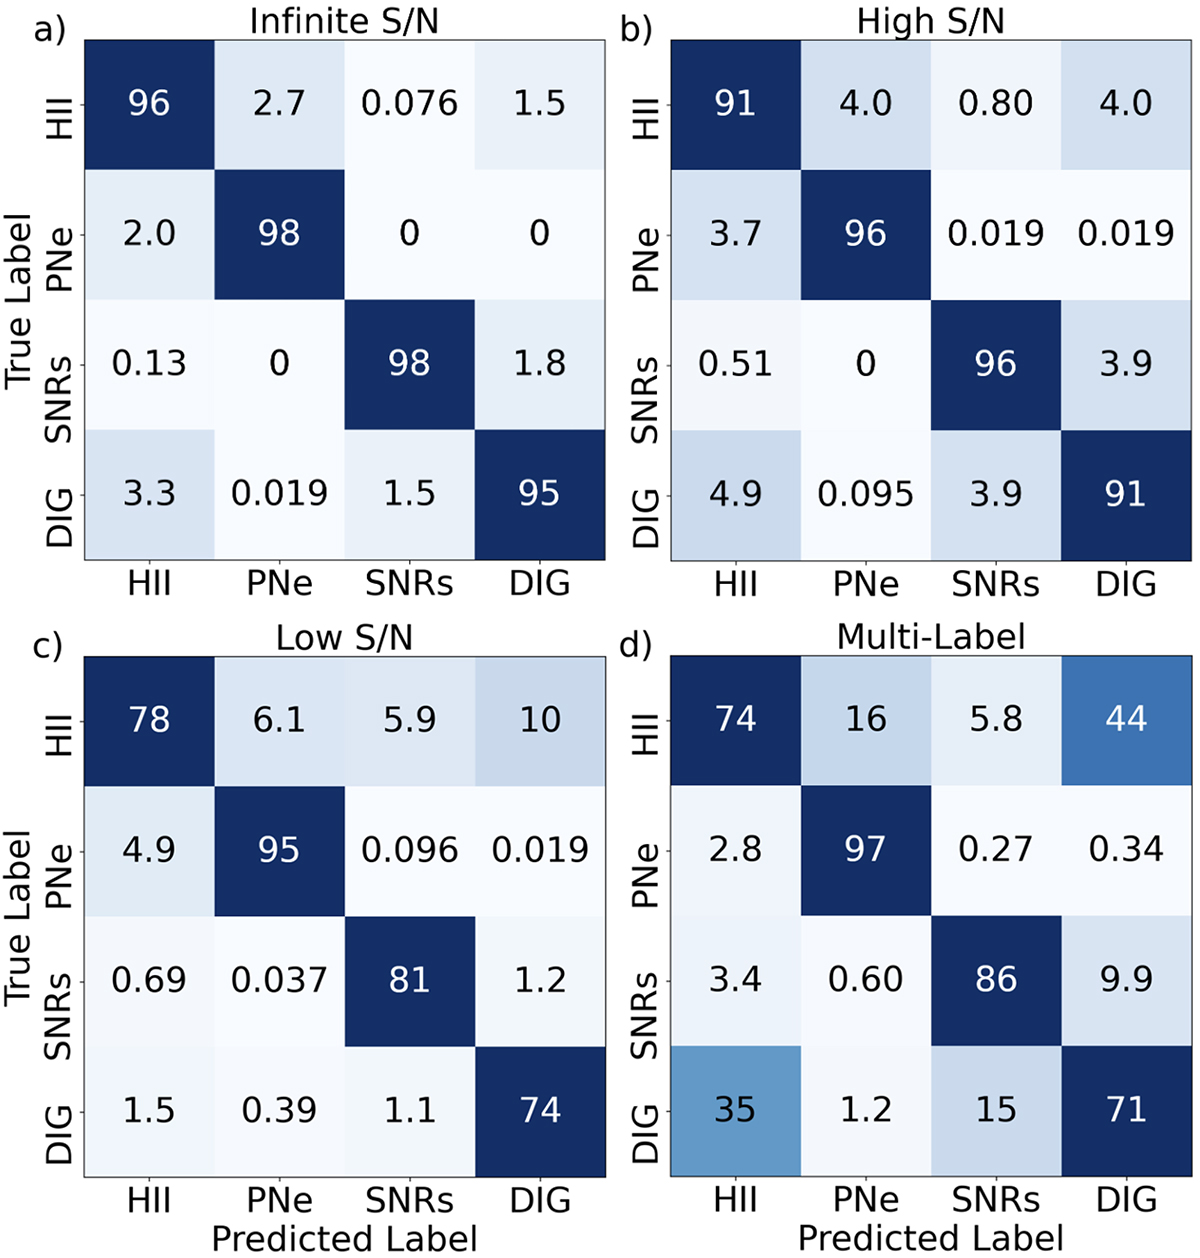
Fig. 3.
Download original image
Confusion matrices comparing the networks’ predicted classification with the true classification for four different test mock datasets. The values shown are percentages. Top row: confusion matrices for the network trained with the single-label high S/N dataset without extinction (panel a) and for the network trained with the high S/N dataset with extinction (panel b). Bottom row: confusion matrices for the network trained with the low S/N dataset without extinction (panel c) and for the network trained with the multi-label dataset (panel d).
Current usage metrics show cumulative count of Article Views (full-text article views including HTML views, PDF and ePub downloads, according to the available data) and Abstracts Views on Vision4Press platform.
Data correspond to usage on the plateform after 2015. The current usage metrics is available 48-96 hours after online publication and is updated daily on week days.
Initial download of the metrics may take a while.