Fig. B.4
Download original image
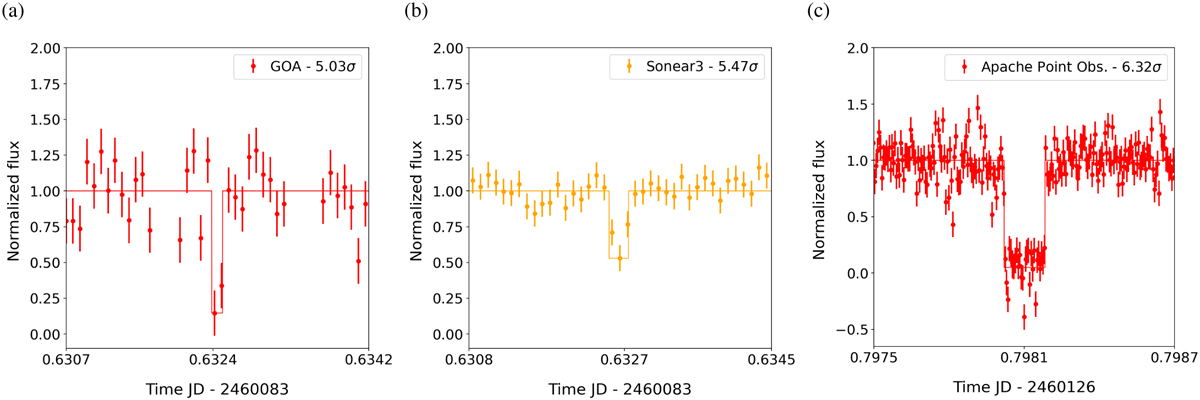
Normalized flux values from the two positive detections, shown in (a) and (b), during Occ. D on May 19, 2023, while (c) presents the normalized flux from the positive detection during Occ. E on July 1, 2023. In all panels, the solid line represents a square-well fit to the observational data. The observing sites and the significance of the flux drop are indicated in the corresponding labels.
Current usage metrics show cumulative count of Article Views (full-text article views including HTML views, PDF and ePub downloads, according to the available data) and Abstracts Views on Vision4Press platform.
Data correspond to usage on the plateform after 2015. The current usage metrics is available 48-96 hours after online publication and is updated daily on week days.
Initial download of the metrics may take a while.