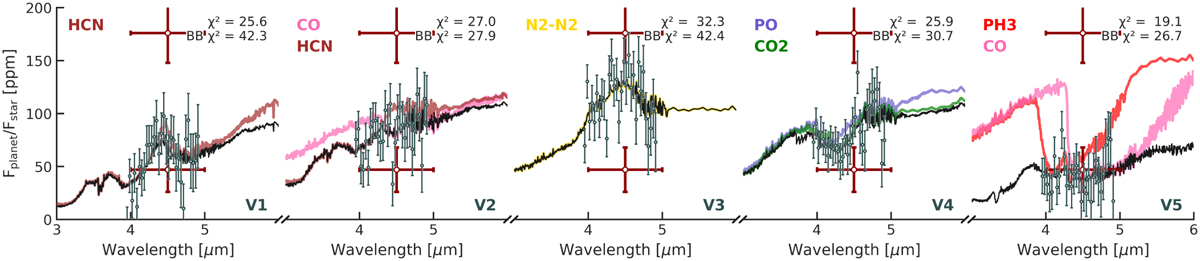
Fig. 8
Download original image
Best-fitting emission spectra models for the stark reduction of all five NIRCam visits from Patel et al. (2024). The visits are ordered from left to right and labelled with V1–V5. Visit 4 is the stark reduction of the same data presented in Hu et al. (2024). The black spectrum is the total emission, with major absorbers highlighted in colour. The dark red points represent the low-flux Spitzer measurement from Demory et al. (2016b). The indicated BB χ2 values are for the best fitting blackbody model for each visit. The fitted models assume full heat redistribution f = 1/4.
Current usage metrics show cumulative count of Article Views (full-text article views including HTML views, PDF and ePub downloads, according to the available data) and Abstracts Views on Vision4Press platform.
Data correspond to usage on the plateform after 2015. The current usage metrics is available 48-96 hours after online publication and is updated daily on week days.
Initial download of the metrics may take a while.