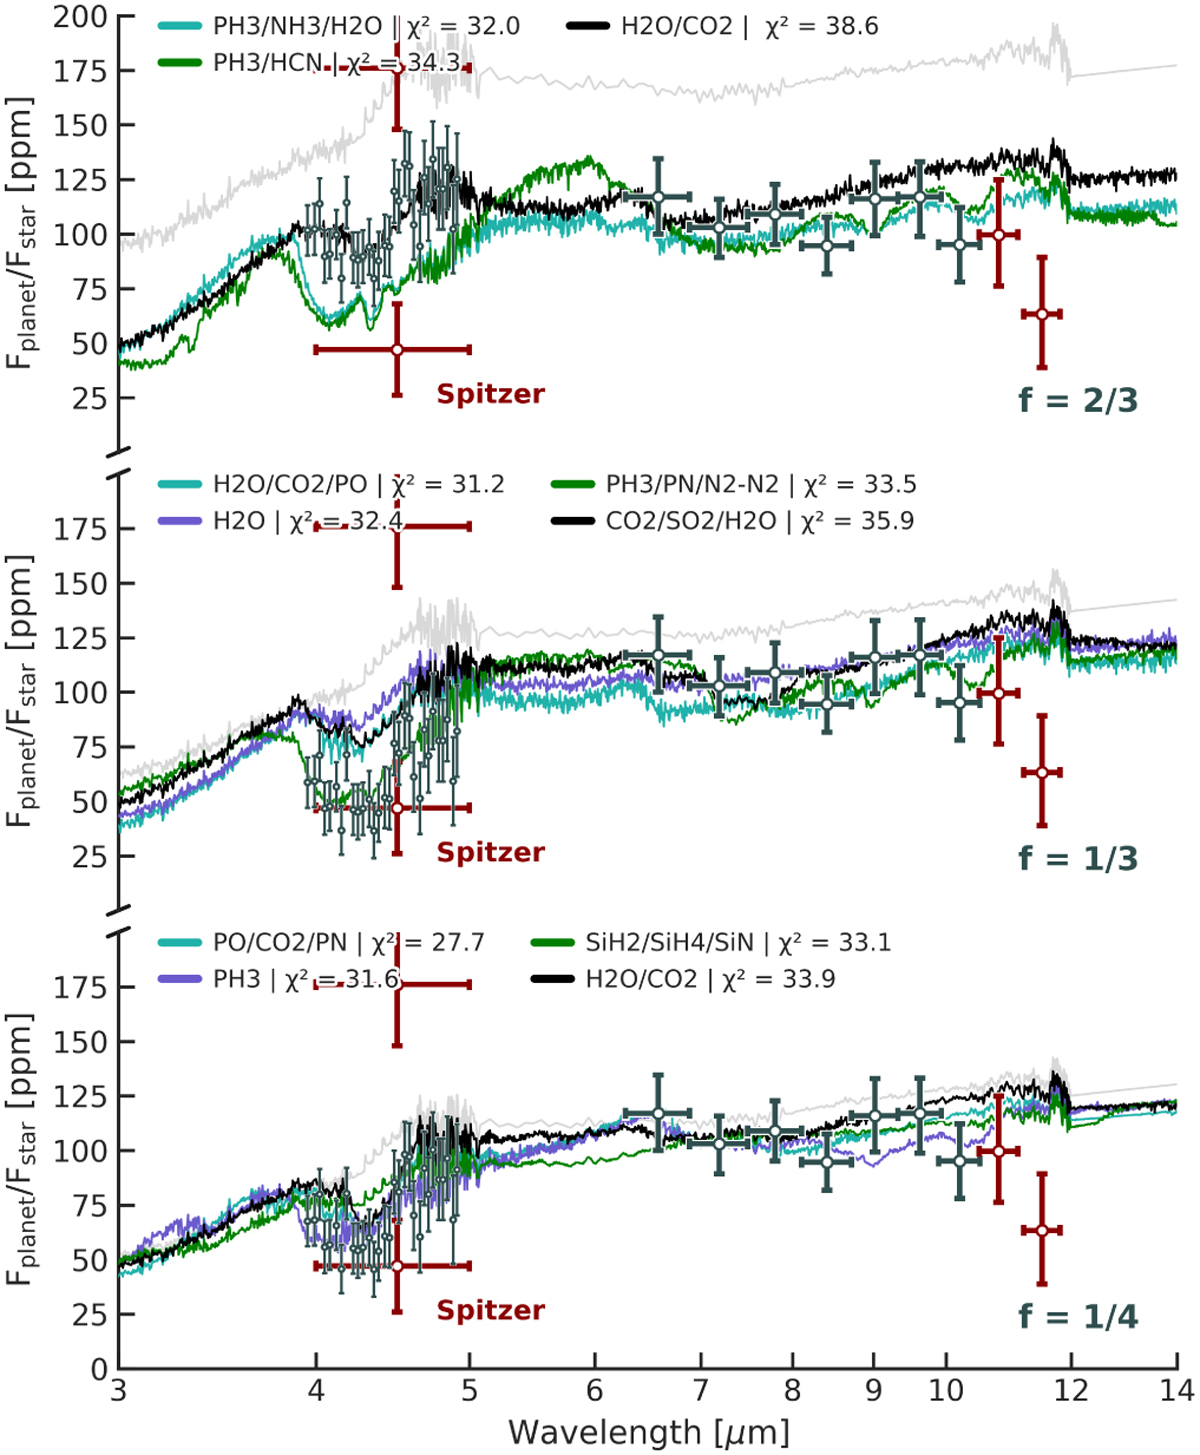
Fig. 2
Download original image
Emission spectra for varying compositions showing degeneracy between heat redistribution and atmospheric composition. Each panel showcases drastically different compositions for each of the heat redistribution f values. Grey curves represent expected blackbody emission for respective f values. The main absorbers contributing to the fit are denoted in the corresponding legends. The calculated χ2 values are for the Eureka! reduction of the JWST data from Hu et al. (2024). The dark red points denote MIRI’s shadow region. Note that the absolute flux of NIRCam is allowed to vary. Also shown is the lower flux Spitzer measurement from Demory et al. (2016b).
Current usage metrics show cumulative count of Article Views (full-text article views including HTML views, PDF and ePub downloads, according to the available data) and Abstracts Views on Vision4Press platform.
Data correspond to usage on the plateform after 2015. The current usage metrics is available 48-96 hours after online publication and is updated daily on week days.
Initial download of the metrics may take a while.