Fig. B.1
Download original image
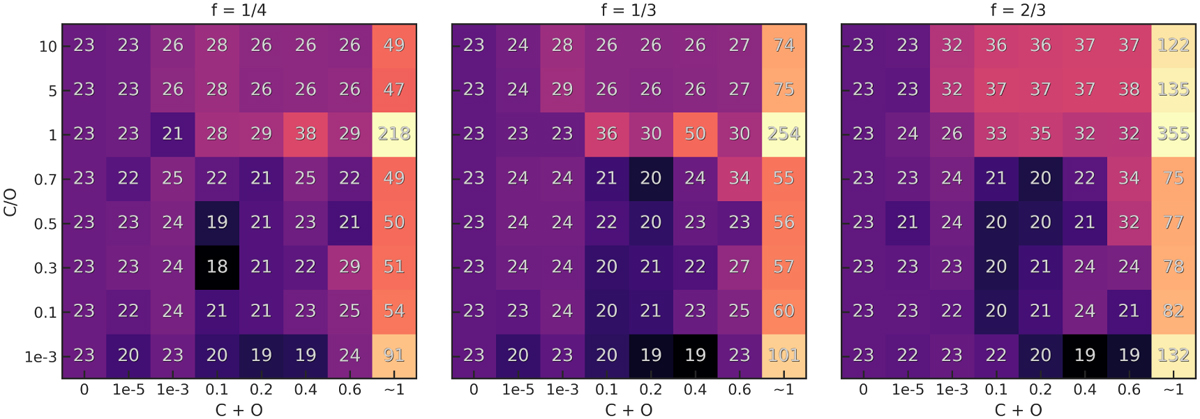
Minimum χ2 values for varying carbon and oxygen mole fractions as a function of the C/O ratio for the Eureka! reduction of the NIRCam spectrum from Hu et al. (2024). Each panel corresponds to a specific temperature regime, indicated by the f value above. The colour gradient and numerical labels represent the minimum χ2 values for each case.
Current usage metrics show cumulative count of Article Views (full-text article views including HTML views, PDF and ePub downloads, according to the available data) and Abstracts Views on Vision4Press platform.
Data correspond to usage on the plateform after 2015. The current usage metrics is available 48-96 hours after online publication and is updated daily on week days.
Initial download of the metrics may take a while.