Fig. 18
Download original image
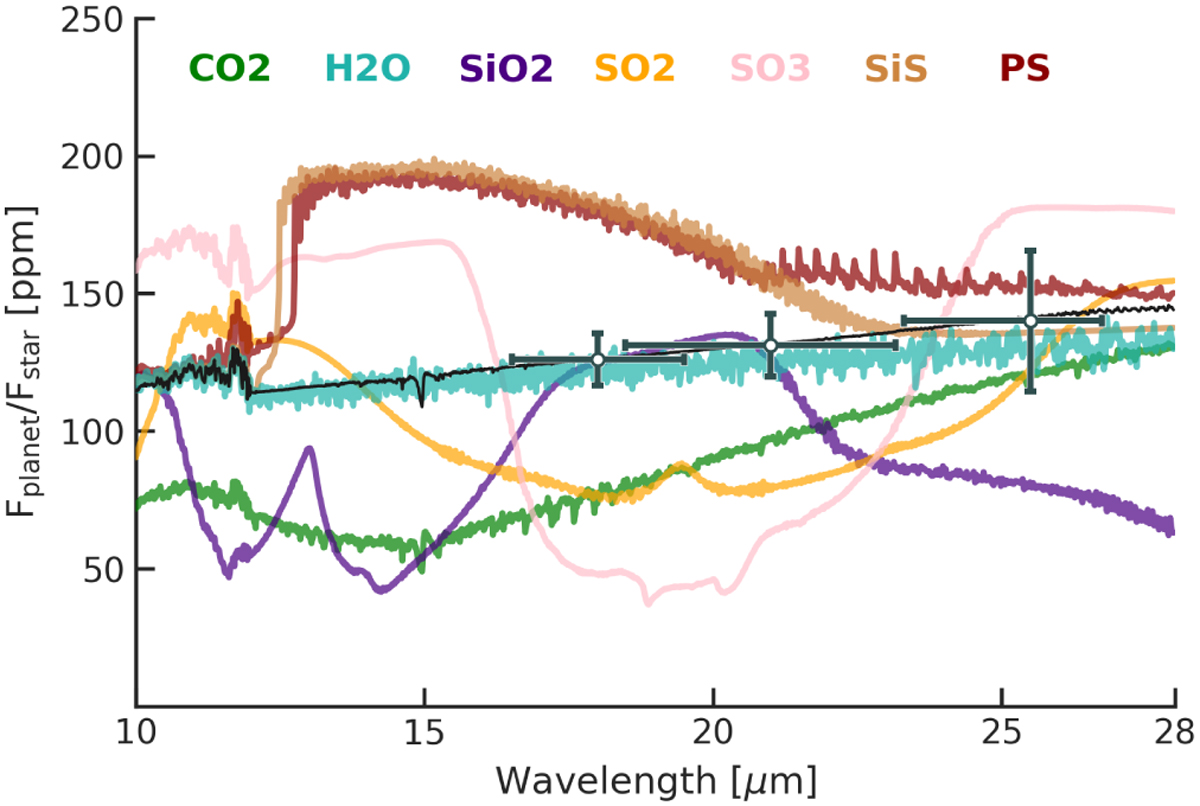
Contribution of individual opacities for the MIRI photometric region. The black spectrum is the PO/CO2 model that is also shown in Figure 1. Coloured spectra correspond to models where the indicated species is the dominant opacity contributor. The calculated MIRI photometric noise corresponds to 3 eclipses for the F1800W and F2100W filters, and 4 eclipses for the F2550W filter.
Current usage metrics show cumulative count of Article Views (full-text article views including HTML views, PDF and ePub downloads, according to the available data) and Abstracts Views on Vision4Press platform.
Data correspond to usage on the plateform after 2015. The current usage metrics is available 48-96 hours after online publication and is updated daily on week days.
Initial download of the metrics may take a while.