Fig. 17
Download original image
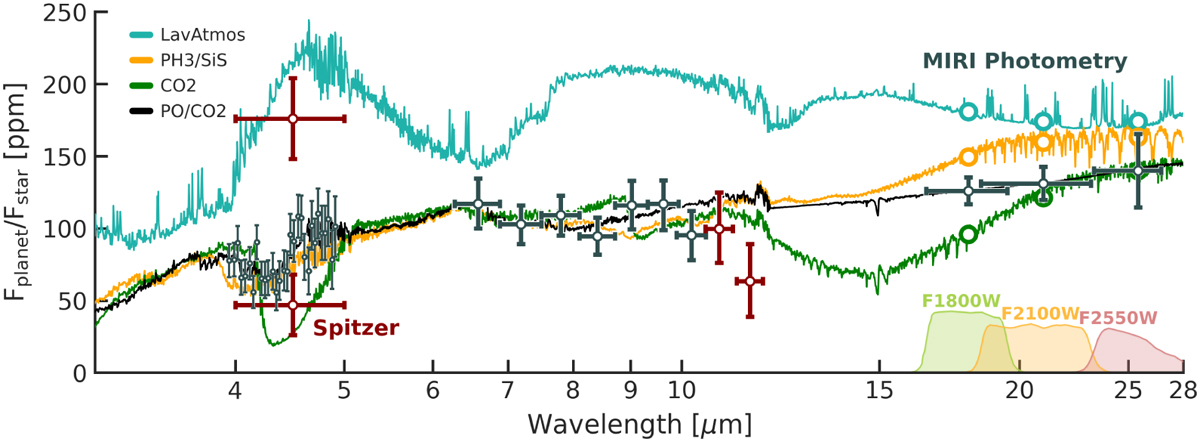
Selection of emission spectra with estimated MIRI photometry noise for 18, 21, and 25 μm. The black spectrum corresponds to the PO/CO2 model from Figure 1. The green spectrum is a CO2-dominated model. The orange spectrum reflects a PH3/SiS-rich composition. The turquoise spectrum is a volatile atmosphere that is affected by the vaporisation of the melt, as shown in Figure 12, and represent a strong inversion case where the temperature regime is set to f = 2/3. The Spitzer data is from Demory et al. (2016b), and the NIRCam and MIRI data points are for the Eureka! reduction from Hu et al. (2024). The calculated MIRI photometric noise corresponds to three eclipses for the F1800W and F2100W filters, and four eclipses for the F2550W filter.
Current usage metrics show cumulative count of Article Views (full-text article views including HTML views, PDF and ePub downloads, according to the available data) and Abstracts Views on Vision4Press platform.
Data correspond to usage on the plateform after 2015. The current usage metrics is available 48-96 hours after online publication and is updated daily on week days.
Initial download of the metrics may take a while.