Fig. 13
Download original image
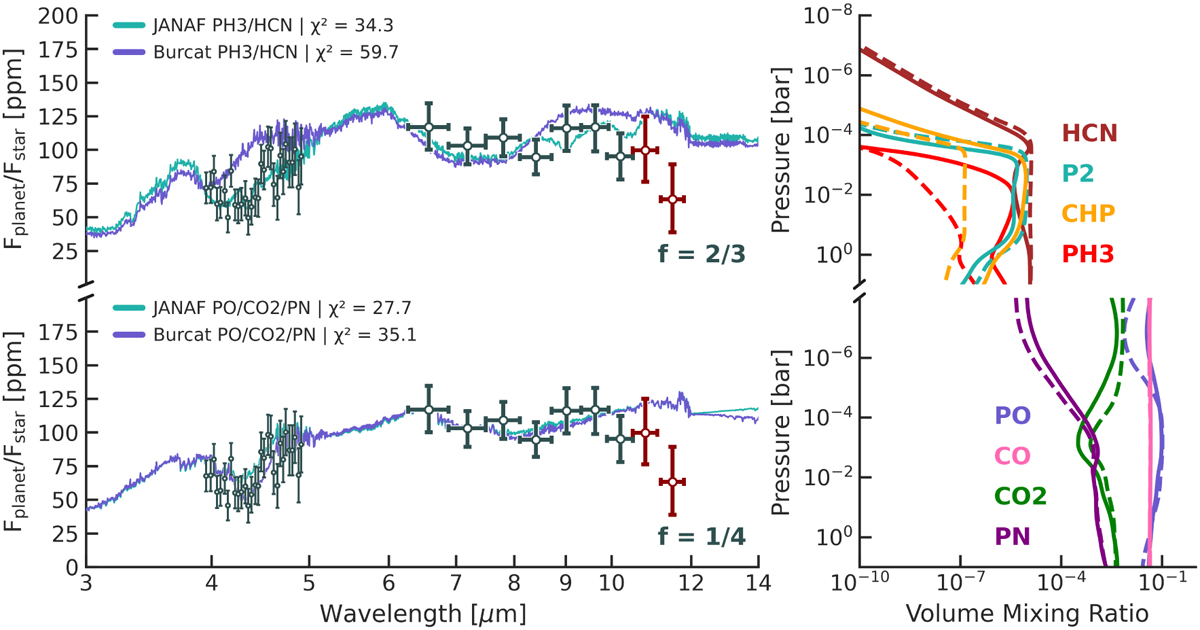
Comparison of emission spectra for models using NIST-JANAF versus Burcat (NASA9) thermodynamic data. The upper panel shows the PH3/HCN model for f = 2/3 from Figure 3, along with volume mixing ratios of key species. Solid lines represent abundances for the NIST-JANAF models, while dashed lines correspond to the Burcat models. The lower panel shows the PO/CO2 models for f = 1/4 model from Figure 1. Also show is the Eureka! reduction of the NIRCam and MIRI data from Hu et al. (2024).
Current usage metrics show cumulative count of Article Views (full-text article views including HTML views, PDF and ePub downloads, according to the available data) and Abstracts Views on Vision4Press platform.
Data correspond to usage on the plateform after 2015. The current usage metrics is available 48-96 hours after online publication and is updated daily on week days.
Initial download of the metrics may take a while.