Fig. 12
Download original image
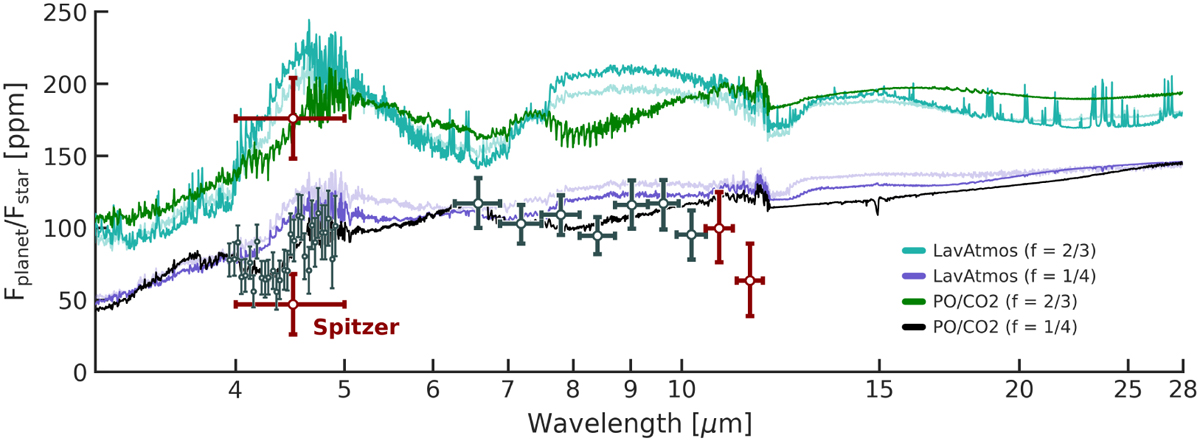
Differences in emission spectra resulting from melt vaporisation into a volatile atmosphere. The black spectrum represents the PO- and CO-rich atmospheric composition showcased in Figure 1, assuming f = 1/4. The green spectrum corresponds to an identical composition, but for a dayside-confined temperature regime ( f = 2/3). The other coloured spectra illustrate the effects of melt vaporisation for each heat redistribution value, modelled using LavAtmos. Bright spectra represent a 1 bar volatile atmosphere, while faded spectra correspond to a 10 bar volatile atmosphere. The shown JWST data is the Eureka! reduction of the NIRCam and MIRI observations from Hu et al. (2024). The two photometric points are the Spitzer data from Demory et al. (2016b).
Current usage metrics show cumulative count of Article Views (full-text article views including HTML views, PDF and ePub downloads, according to the available data) and Abstracts Views on Vision4Press platform.
Data correspond to usage on the plateform after 2015. The current usage metrics is available 48-96 hours after online publication and is updated daily on week days.
Initial download of the metrics may take a while.