Fig. 1
Download original image
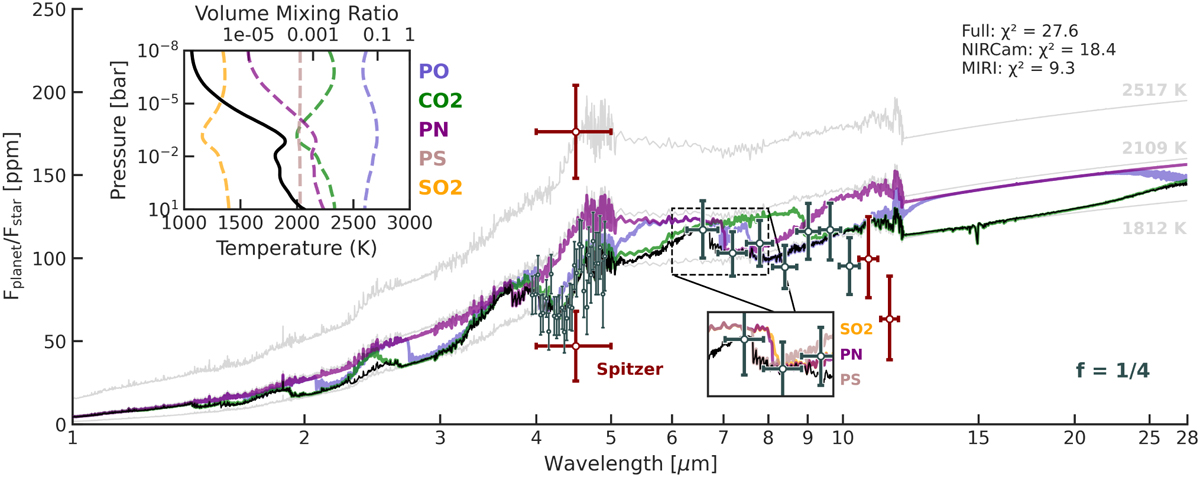
Best-fitting emission spectrum (black) for 55 Cancri e from our results. The coloured spectra show individual contributions of the strongest opacities in the model, PO (blue), CO2 (green), and PN (purple). The faint grey spectra, arranged from top to bottom, represent blackbody emission for heat redistribution values of f = 1.0 (substellar temperature), f = 2/3 (dayside-confined), and f = 1/4 (global redistribution), with the equilibrium temperature labelled above each corresponding curve. The spectrum is fitted to the Eureka! reduction of the JWST observations from Hu et al. (2024) (NIRCam and MIRI/LRS). The NIRCam absolute flux is not constrained, allowing the data to shift. A depth of 79 ppm is used in the figure. The last two points of MIRI beyond 10 μm (dark red) represent the ‘shadow region’ of the data. The model assumes heat redistribution coefficient f = 1/4 (global redistribution). The legend in the upper right denotes the calculated χ2 values for the combined MIRI + NIRCam fit (Full), as well as for the individual NIRCam and MIRI fits to the black spectrum. Overlaid on the spectrum are the two Spitzer (red) observations from Demory et al. (2016b). The upper-left inset shows the temperature profile as well as volume mixing ratios of the major absorbers. The lower inset is a zoom in of the 6-8 μm region highlighting the absorption overlap of additional species: SO2, PN, and PS.
Current usage metrics show cumulative count of Article Views (full-text article views including HTML views, PDF and ePub downloads, according to the available data) and Abstracts Views on Vision4Press platform.
Data correspond to usage on the plateform after 2015. The current usage metrics is available 48-96 hours after online publication and is updated daily on week days.
Initial download of the metrics may take a while.