Fig. 4
Download original image
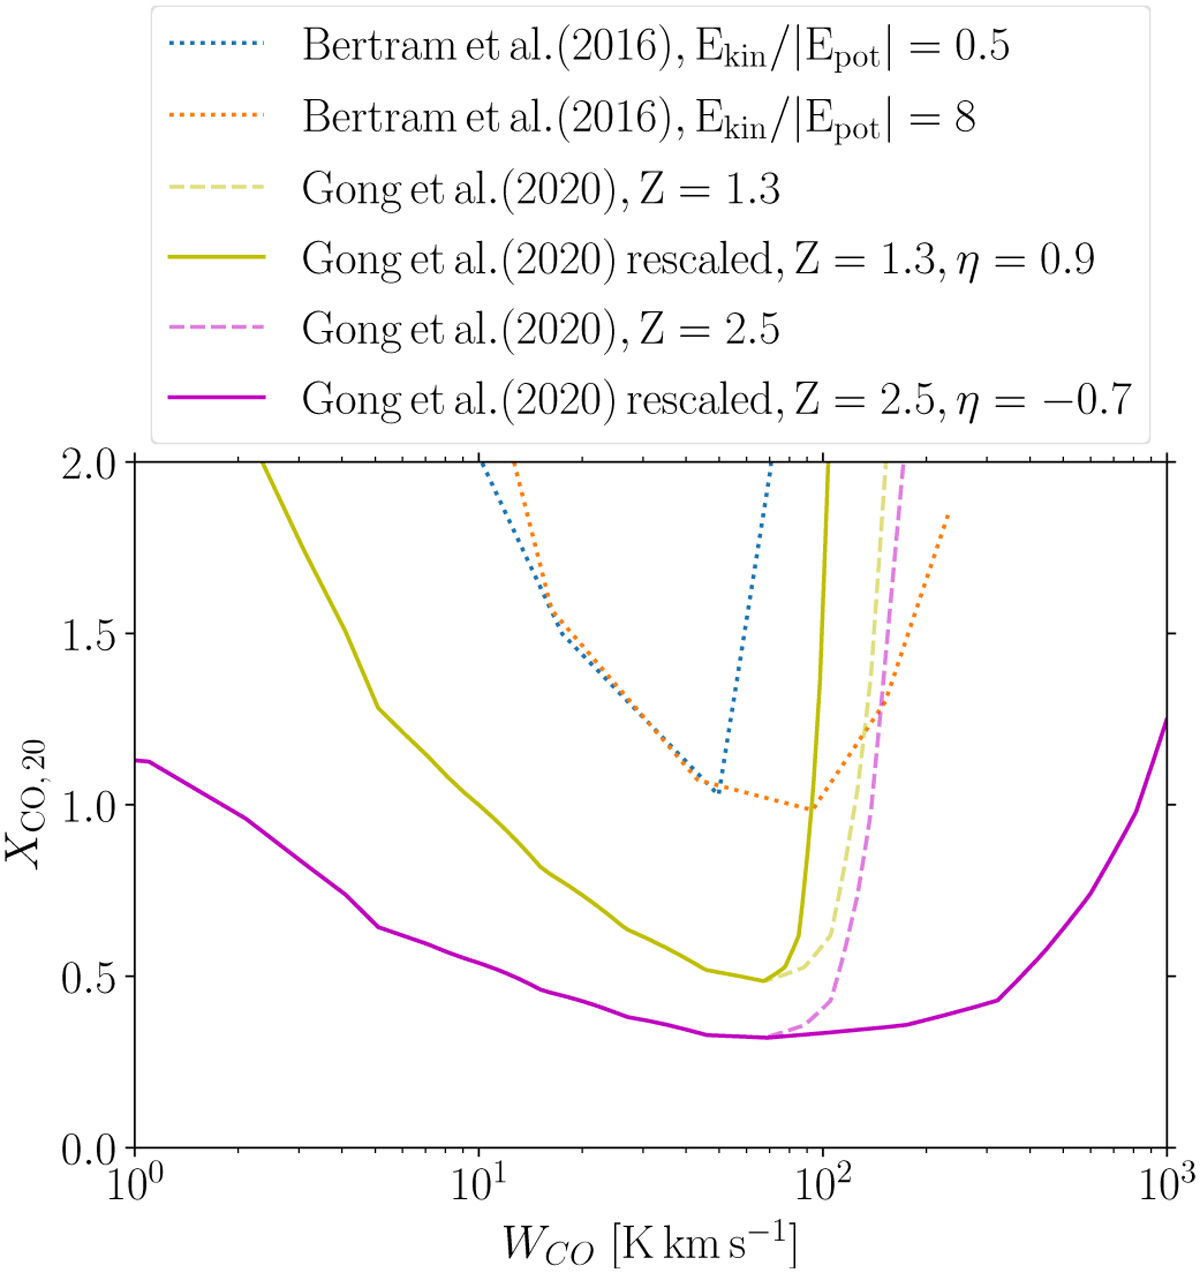
Mean trend for the XCO factor evolution as a function of WCO as predicted by simulations, adapted from Figure 6 of Bertram et al. (2016) and Figure 10 of Gong et al. (2020). The effect of the turbulence is taken into account in Bertram et al. (2016) by varying the ratio of kinetic and potential energies (dotted curves). The dashed curves correspond to the reference functions from Gong et al. (2020), noted ![]() in Eq. (6). A power-law correction of index η can be applied to this curve in order to mimic the effect of the turbulence, as proposed in Eq. (8).
in Eq. (6). A power-law correction of index η can be applied to this curve in order to mimic the effect of the turbulence, as proposed in Eq. (8).
Current usage metrics show cumulative count of Article Views (full-text article views including HTML views, PDF and ePub downloads, according to the available data) and Abstracts Views on Vision4Press platform.
Data correspond to usage on the plateform after 2015. The current usage metrics is available 48-96 hours after online publication and is updated daily on week days.
Initial download of the metrics may take a while.