Fig. 3
Download original image
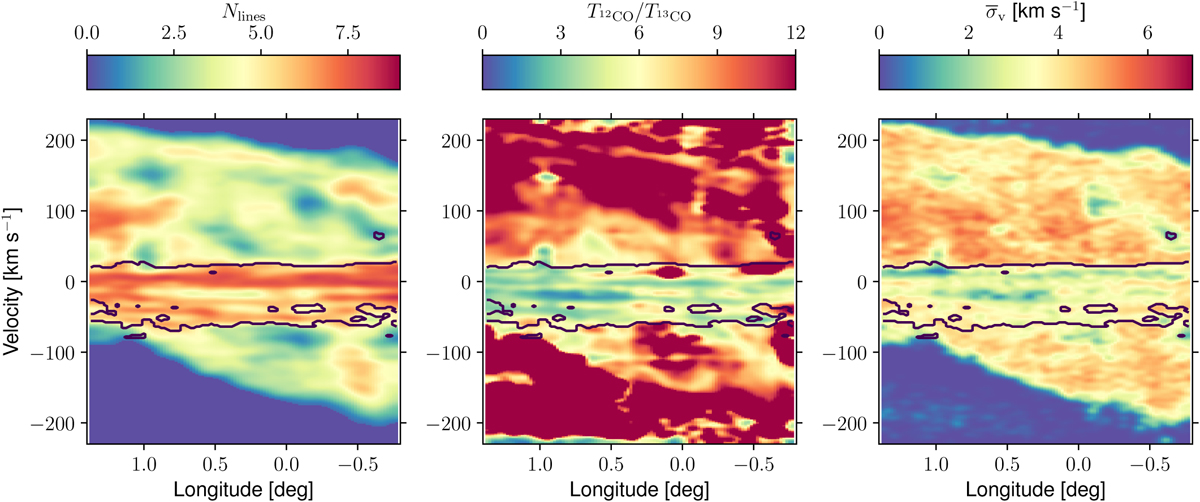
From left to right: longitude-velocity diagrams of the number of 12CO lines, the brightness temperature ratio of 12CO to 13CO, and the 12CO line width. For each (l,v) pixel, the number of lines is summed over latitudes while the two other quantities are averaged. The maps have been smoothed with a Gaussian kernel of 2 pixels in standard deviation for display. The contours give the outline of the two components separated by hierarchical clustering using these three parameters maps as input. Pixels outside of the contour are associated with the CMZ, and those inside are associated with the disk, if they also verify the other conditions described in the text (see Sect. 3.2).
Current usage metrics show cumulative count of Article Views (full-text article views including HTML views, PDF and ePub downloads, according to the available data) and Abstracts Views on Vision4Press platform.
Data correspond to usage on the plateform after 2015. The current usage metrics is available 48-96 hours after online publication and is updated daily on week days.
Initial download of the metrics may take a while.