Fig. 15
Download original image
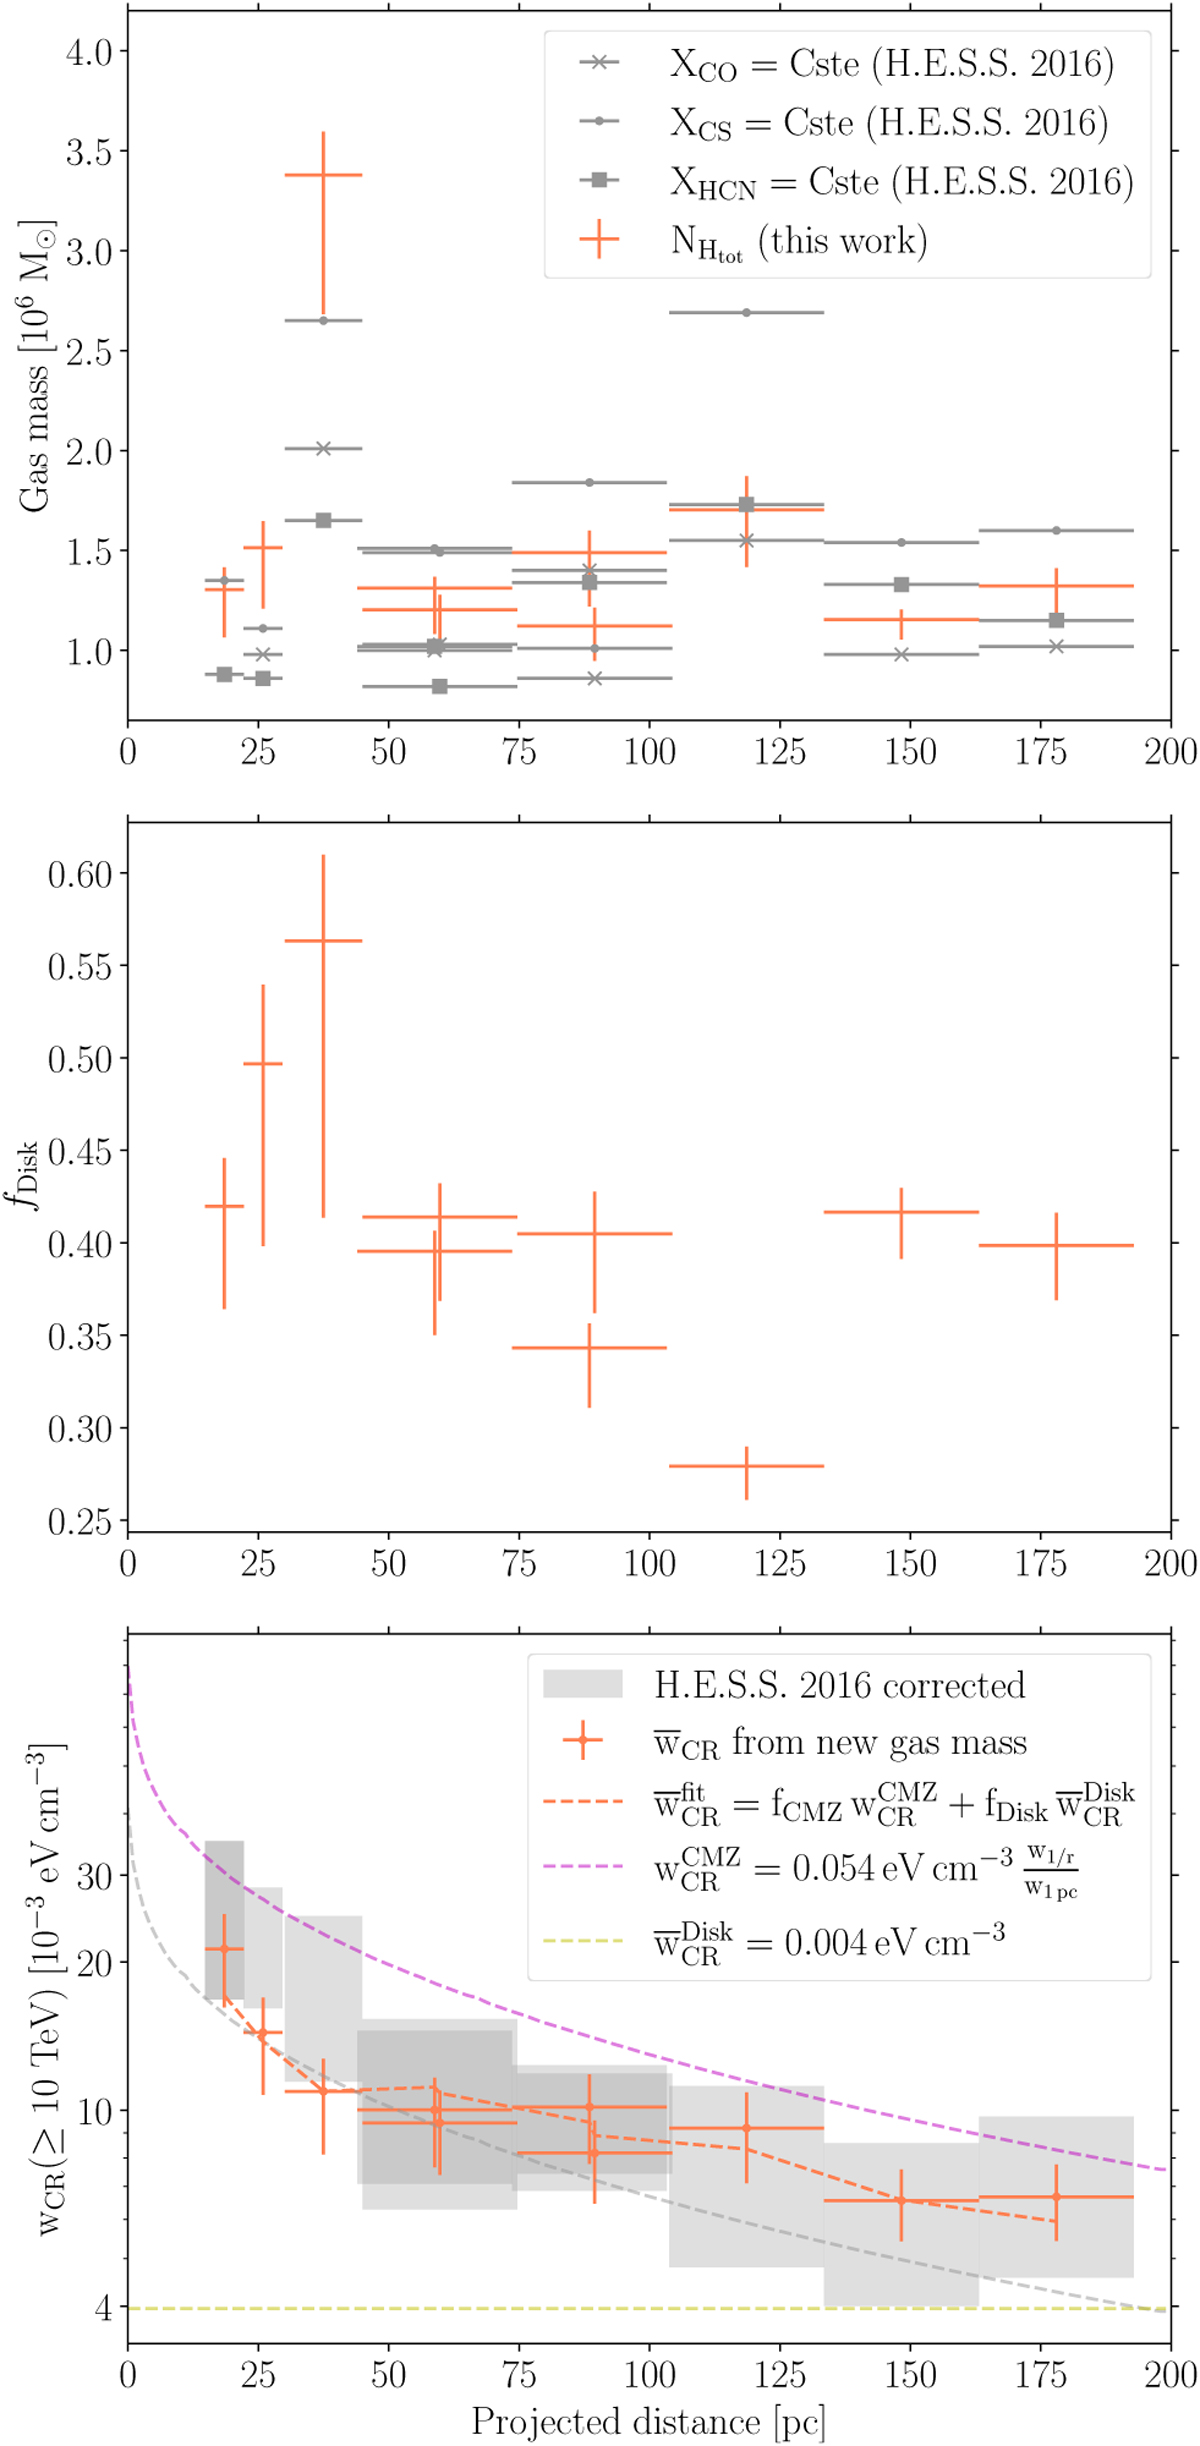
Top: gas mass estimates from H.E.S.S. Collaboration (2016) in grey and from this work in orange. Middle: fraction of disk contamination in the total hydrogen column density. Bottom: average CR density as a function of its projected distance from Sgr A*. The grey items are adapted from H.E.S.S. Collaboration (2016), including the systematic uncertainties associated to the choice of gas tracer, and the correction we discuss in the footnote 5. The grey line is the 1/r profile in CR density integrated over the line of sight provided in their paper as a fit to the data points. The orange error bars give the values derived from our mass estimates. The orange line corresponds to the fit to these points considering a 1/r profile for the CMZ component (magenta) and a constant for the disk component (yellow).
Current usage metrics show cumulative count of Article Views (full-text article views including HTML views, PDF and ePub downloads, according to the available data) and Abstracts Views on Vision4Press platform.
Data correspond to usage on the plateform after 2015. The current usage metrics is available 48-96 hours after online publication and is updated daily on week days.
Initial download of the metrics may take a while.