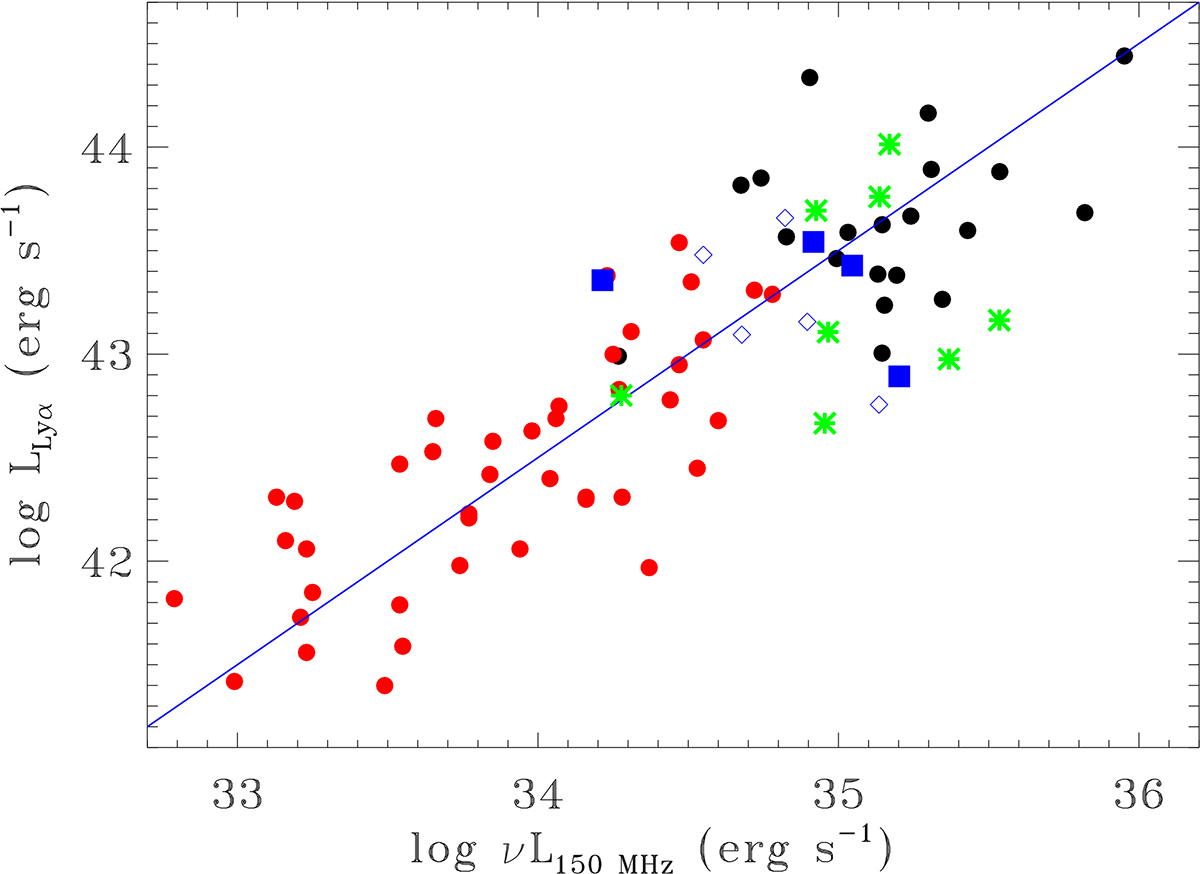
Fig. 7.
Download original image
Comparison of the radio and Lyα luminosities for various samples of RGs. The black circles show HzRGs at z ∼ 2−3.5 from Roettgering et al. (1997), the red circles show high-excitation 3C RGs with z < 0.3 from Buttiglione et al. (2010), having assumed Lyα/Hα = 5, the blue diamonds mark the five RGs at z > 4 cited in the text, the green stars show eight HzRGs with MUSE observations, and the blue squares show the four HzRGs confirmed by this study. The blue line represents the locus of a constant ratio of LLyα and Lradio.
Current usage metrics show cumulative count of Article Views (full-text article views including HTML views, PDF and ePub downloads, according to the available data) and Abstracts Views on Vision4Press platform.
Data correspond to usage on the plateform after 2015. The current usage metrics is available 48-96 hours after online publication and is updated daily on week days.
Initial download of the metrics may take a while.