Fig. 5.
Download original image
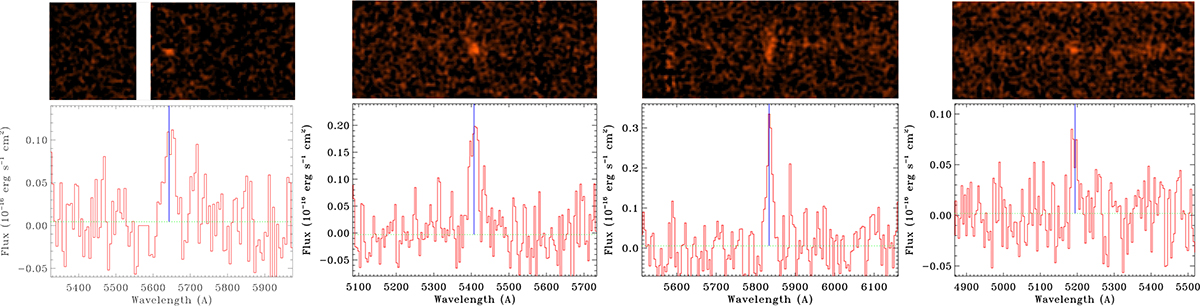
Spectra obtained from the NTT observations for the four HzRG candidates in which we detected an emission line, most likely Lyα, at an S/N > 5. From left to right, we show NVSS J021439–002359, NVSS J220526–291029, NVSS J221708–325449, and NVSS J231647–344233. In the top panels, we show the two dimensional spectra, convolved with a Gaussian filter with a FWHM of 0![]() 5 for visual purposes (the white area in the first panel masks a region corresponding to a bright sky line). The spatial extent of the spectra is 10″. In the bottom panels, we present the optimally extracted spectra with the same wavelength range as in the top panels. The dashed horizontal green lines mark the continuum level, and the vertical blue lines mark the center of the Lyα line from which we derived the redshift reported in Table 1.
5 for visual purposes (the white area in the first panel masks a region corresponding to a bright sky line). The spatial extent of the spectra is 10″. In the bottom panels, we present the optimally extracted spectra with the same wavelength range as in the top panels. The dashed horizontal green lines mark the continuum level, and the vertical blue lines mark the center of the Lyα line from which we derived the redshift reported in Table 1.
Current usage metrics show cumulative count of Article Views (full-text article views including HTML views, PDF and ePub downloads, according to the available data) and Abstracts Views on Vision4Press platform.
Data correspond to usage on the plateform after 2015. The current usage metrics is available 48-96 hours after online publication and is updated daily on week days.
Initial download of the metrics may take a while.