Fig. 3.
Download original image
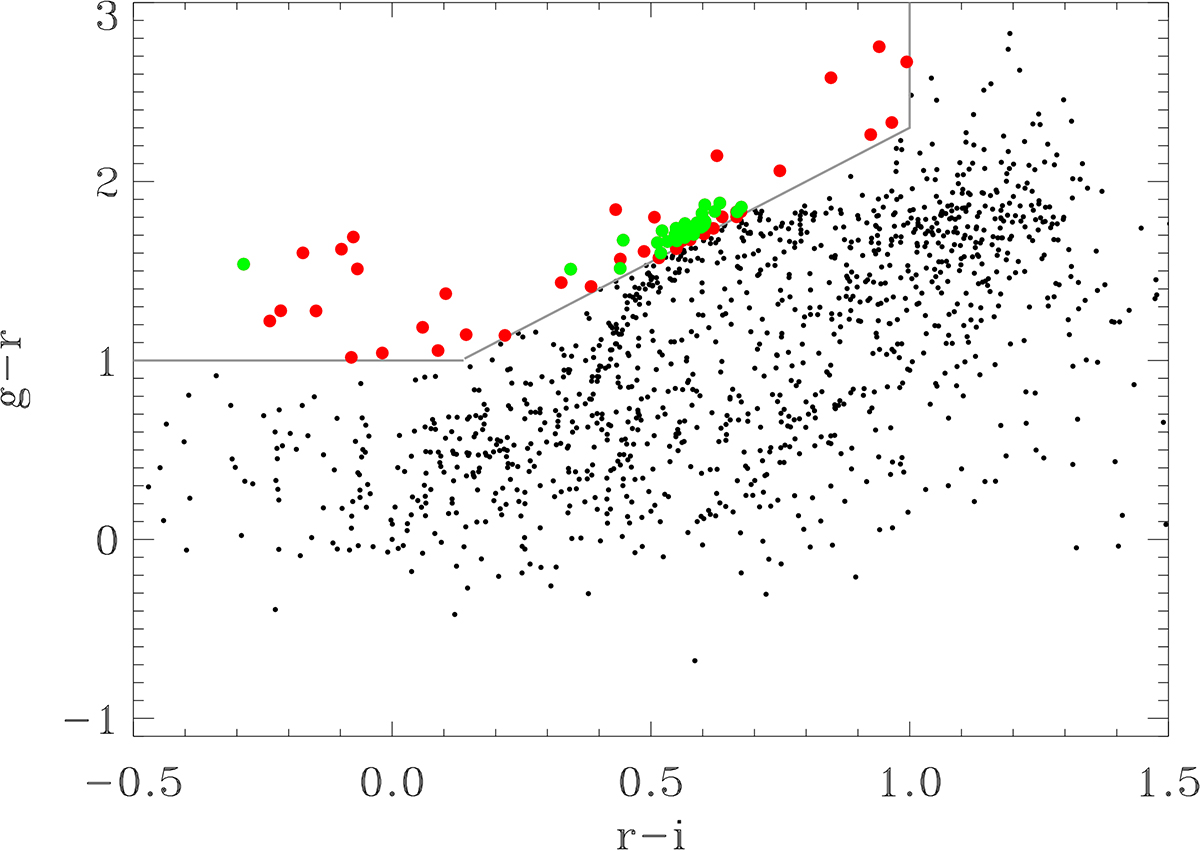
Example of color-color (r − i vs. g − r) plot of the optical sources in the KiDS area that are counterparts of TGSS radio sources. We indicate the sources that meet the criteria for a g-band dropout (red) and that meet the more conservative criterion (green), requiring that the whole ellipse defined by the 1σ errors falls into the g-dropout area.
Current usage metrics show cumulative count of Article Views (full-text article views including HTML views, PDF and ePub downloads, according to the available data) and Abstracts Views on Vision4Press platform.
Data correspond to usage on the plateform after 2015. The current usage metrics is available 48-96 hours after online publication and is updated daily on week days.
Initial download of the metrics may take a while.