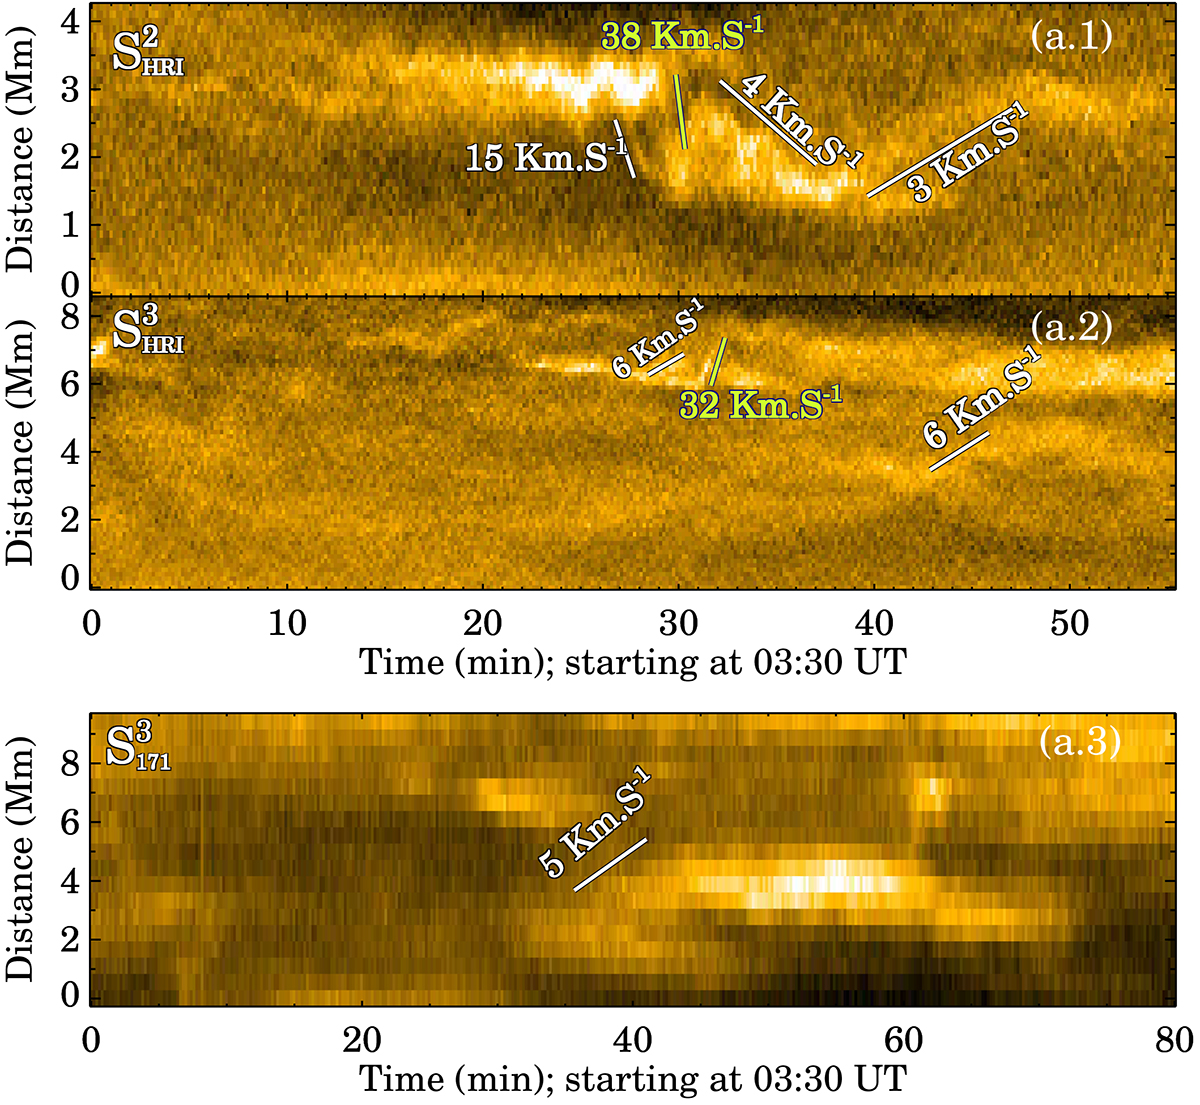
Fig. 4.
Download original image
Estimation of the drift speeds of the loops. The x-t maps are the same as those in Fig. 3. To guide the eye, the white slanted lines outline the slopes that indicate the drift speeds of the loops, while the two green lines represent the slopes associated with the loop splits. The derived speed values are printed on the panels.
Current usage metrics show cumulative count of Article Views (full-text article views including HTML views, PDF and ePub downloads, according to the available data) and Abstracts Views on Vision4Press platform.
Data correspond to usage on the plateform after 2015. The current usage metrics is available 48-96 hours after online publication and is updated daily on week days.
Initial download of the metrics may take a while.