Fig. 3.
Download original image
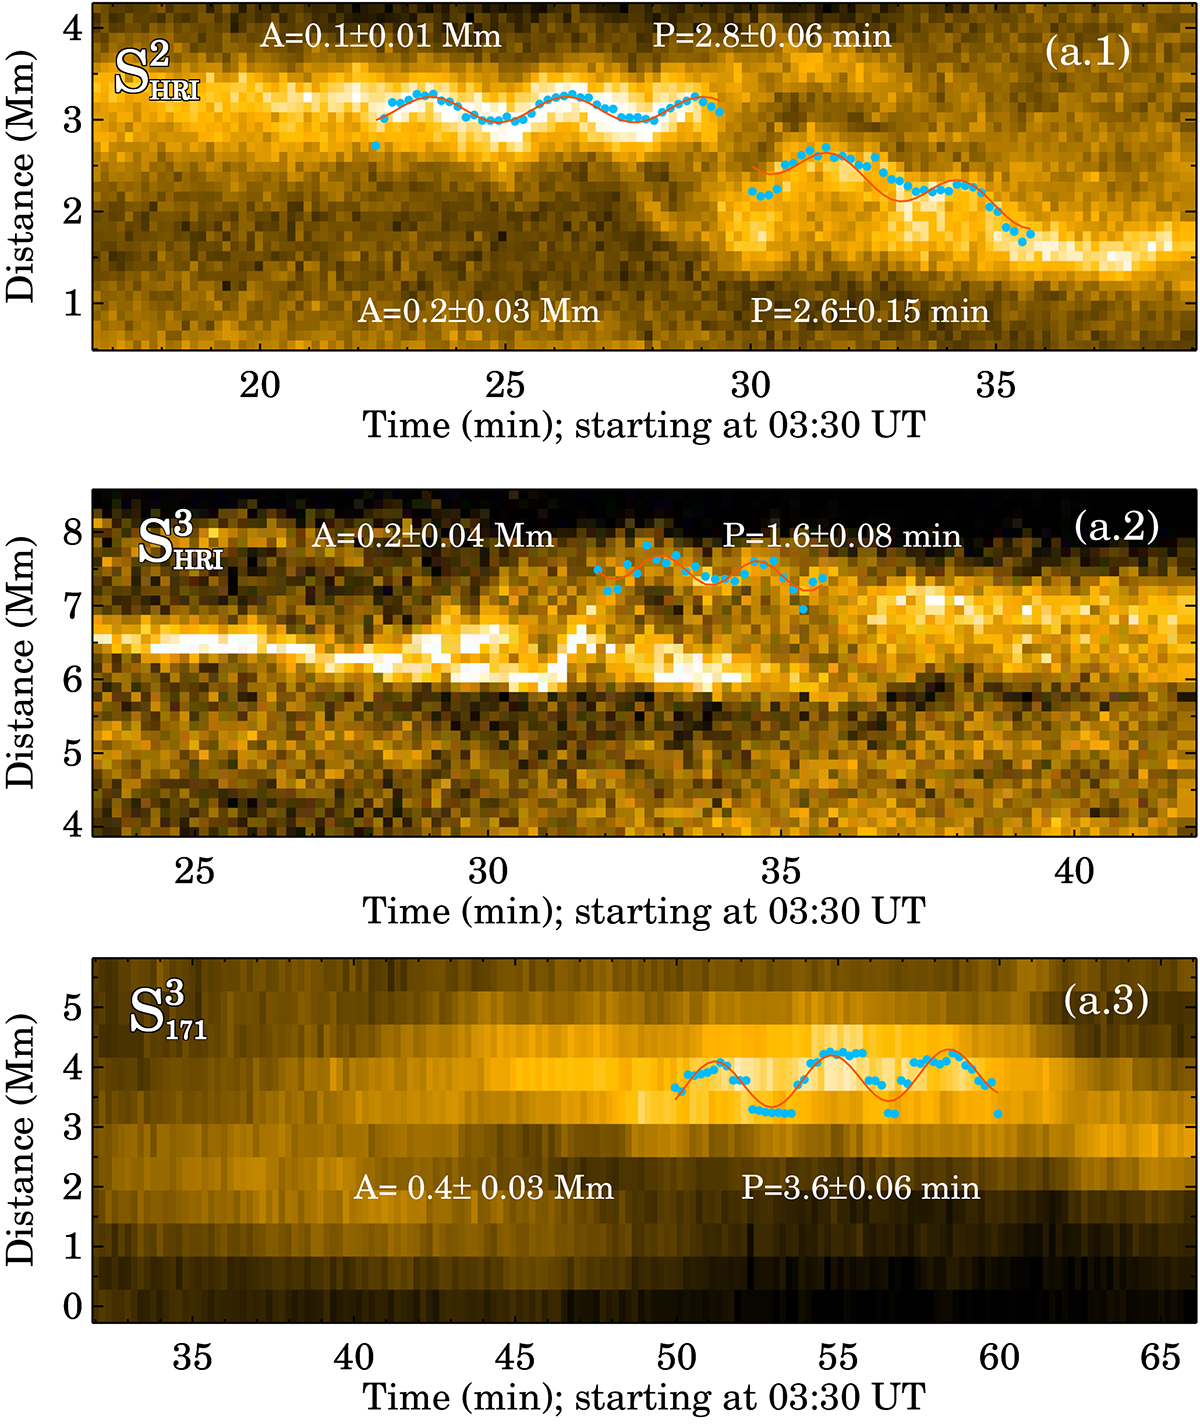
Zoomed-in views of the kink oscillations occurring in the loops. Panels a.1, a.2, and a.3 display portions of the x-t maps derived from slits S![]() , S
, S![]() , and S
, and S![]() , respectively. In each x-t map, the cyan dots indicate the outline of the oscillating thread, as determined by fitting a Gaussian function across the transverse direction of these maps, while the red curve represents the sinusoidal function fitted to the detected thread. The amplitude and period values for each fitted thread are displayed in the panels.
, respectively. In each x-t map, the cyan dots indicate the outline of the oscillating thread, as determined by fitting a Gaussian function across the transverse direction of these maps, while the red curve represents the sinusoidal function fitted to the detected thread. The amplitude and period values for each fitted thread are displayed in the panels.
Current usage metrics show cumulative count of Article Views (full-text article views including HTML views, PDF and ePub downloads, according to the available data) and Abstracts Views on Vision4Press platform.
Data correspond to usage on the plateform after 2015. The current usage metrics is available 48-96 hours after online publication and is updated daily on week days.
Initial download of the metrics may take a while.