Fig. 2.
Download original image
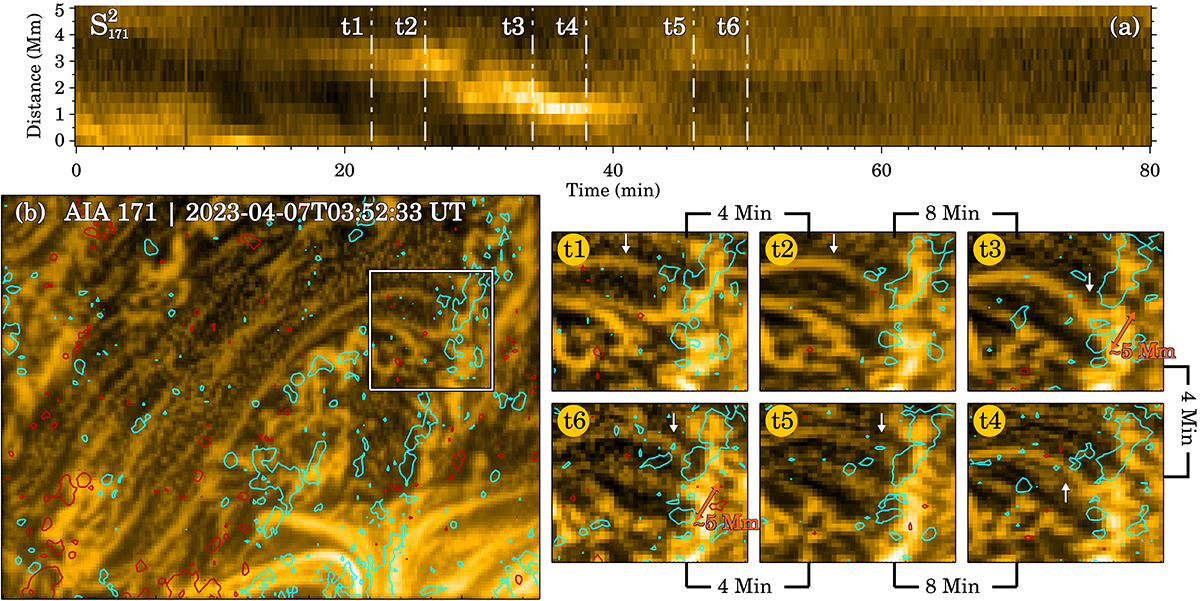
Associations with the photospheric magnetic field. Panel a presents the x-t map from S![]() , while panel b shows a subsection of the AIA 171 Å image that encompasses the loop system studied in this paper. The cyan and red contours overlaid on panel b represent boundaries of ±20 G, derived from the co-temporal HMI LOS magnetogram. The white rectangle in panel b outlines a sub-FOV that contains the west-side footpoint region of the loop system. The six side panels next to panel b display snapshots of the sub-FOV at six different times, labeled t1–t6. These six timestamps are highlighted with dash-dot vertical lines on the x-t map in panel a. The white arrows in panels t1–t6 mark the loop of interest. The back-and-forth movement of the loop footpoint is better visualized in the animation available online.
, while panel b shows a subsection of the AIA 171 Å image that encompasses the loop system studied in this paper. The cyan and red contours overlaid on panel b represent boundaries of ±20 G, derived from the co-temporal HMI LOS magnetogram. The white rectangle in panel b outlines a sub-FOV that contains the west-side footpoint region of the loop system. The six side panels next to panel b display snapshots of the sub-FOV at six different times, labeled t1–t6. These six timestamps are highlighted with dash-dot vertical lines on the x-t map in panel a. The white arrows in panels t1–t6 mark the loop of interest. The back-and-forth movement of the loop footpoint is better visualized in the animation available online.
Current usage metrics show cumulative count of Article Views (full-text article views including HTML views, PDF and ePub downloads, according to the available data) and Abstracts Views on Vision4Press platform.
Data correspond to usage on the plateform after 2015. The current usage metrics is available 48-96 hours after online publication and is updated daily on week days.
Initial download of the metrics may take a while.