Fig. 1.
Download original image
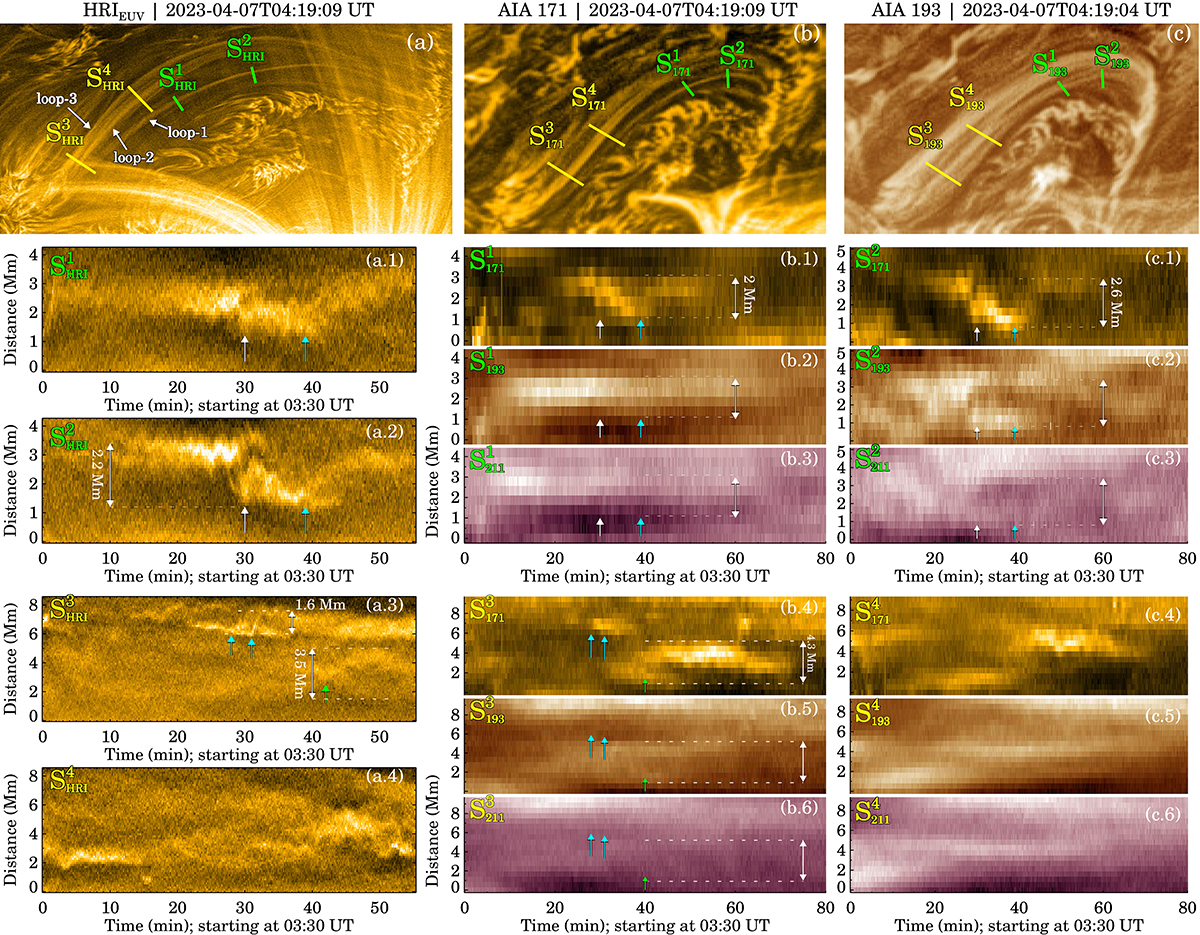
Examples of atypical loop evolution events. Panel a presents the HRIEUV image, with two sets of yellow and green lines outlining the locations of the artificial slits that were used to derive the space-time (x-t) maps shown in panels a.1–a.4. The white, blue, and green arrows in these x-t maps mark the times when split-drift-type events are observed. The three loop structures where these events occur are marked with arrows in panel a. Panels b and c present the co-temporal images recorded in the AIA 171 Å and 193 Å passbands, while the x-t maps derived using these data are shown in panels b.1–c.6. The white, blue, and green arrows on these x-t maps mark the identical timestamps of their HRIEUV counterparts. In b.4–b.6, the green arrow indicates the only event captured by S![]() . The other two events on this map, marked by the blue arrows, are only recorded in the S
. The other two events on this map, marked by the blue arrows, are only recorded in the S![]() map in a.3. The double-sided arrows in the x-t maps outline the drift separation distance as judged visually. To highlight the loop structures, the context images in panels a, b, and c were created by applying a one-minute running average to the respective datasets. Event movies are available online.
map in a.3. The double-sided arrows in the x-t maps outline the drift separation distance as judged visually. To highlight the loop structures, the context images in panels a, b, and c were created by applying a one-minute running average to the respective datasets. Event movies are available online.
Current usage metrics show cumulative count of Article Views (full-text article views including HTML views, PDF and ePub downloads, according to the available data) and Abstracts Views on Vision4Press platform.
Data correspond to usage on the plateform after 2015. The current usage metrics is available 48-96 hours after online publication and is updated daily on week days.
Initial download of the metrics may take a while.