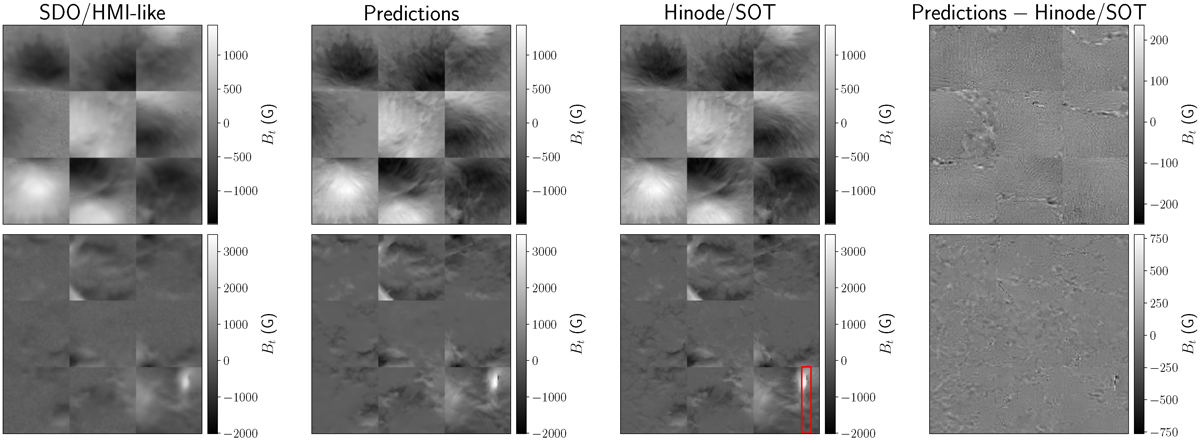
Fig. 8.
Download original image
Nine examples of individual azimuthal field test patches. Left to right: Input data, model output, target output, model error. Top: Results with the lowest RMSE. Bottom: Results with the highest RMSE. The colour scales are the same for the first three panels within each row, while the right-most panel in each row has a distinct colour scale. The misaligned SOT-SP scans are highlighted by the red box.
Current usage metrics show cumulative count of Article Views (full-text article views including HTML views, PDF and ePub downloads, according to the available data) and Abstracts Views on Vision4Press platform.
Data correspond to usage on the plateform after 2015. The current usage metrics is available 48-96 hours after online publication and is updated daily on week days.
Initial download of the metrics may take a while.