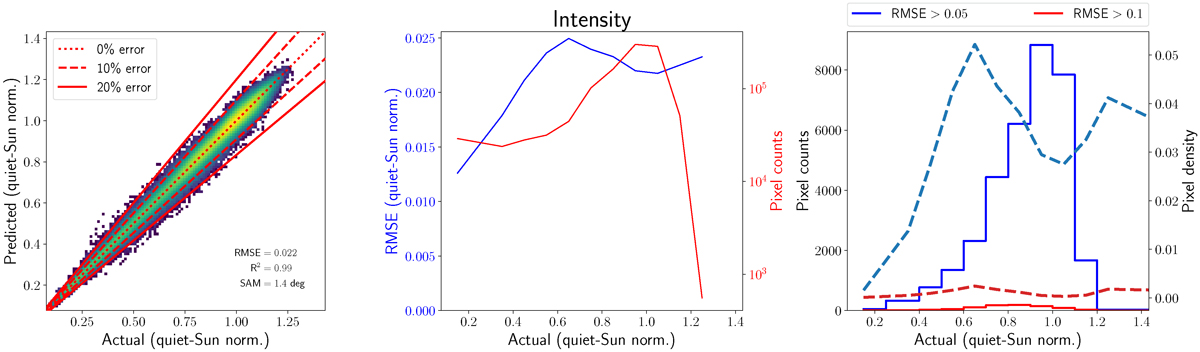
Fig. 3.
Download original image
Error evaluation of the intensity predictions. Left: Log-density plot of pixel-to-pixel correspondence between the actual and predicted values. The red lines delimit certain error levels. Middle: Error estimate of the predictions as a function of actual intensity (typical width of the distribution from the left panel). Right: The distribution of the worst predictions. The full lines show pixel counts while the dashed lines show the pixel densities. The dashed lines are in different colour shades for better visibility.
Current usage metrics show cumulative count of Article Views (full-text article views including HTML views, PDF and ePub downloads, according to the available data) and Abstracts Views on Vision4Press platform.
Data correspond to usage on the plateform after 2015. The current usage metrics is available 48-96 hours after online publication and is updated daily on week days.
Initial download of the metrics may take a while.