Fig. 16.
Download original image
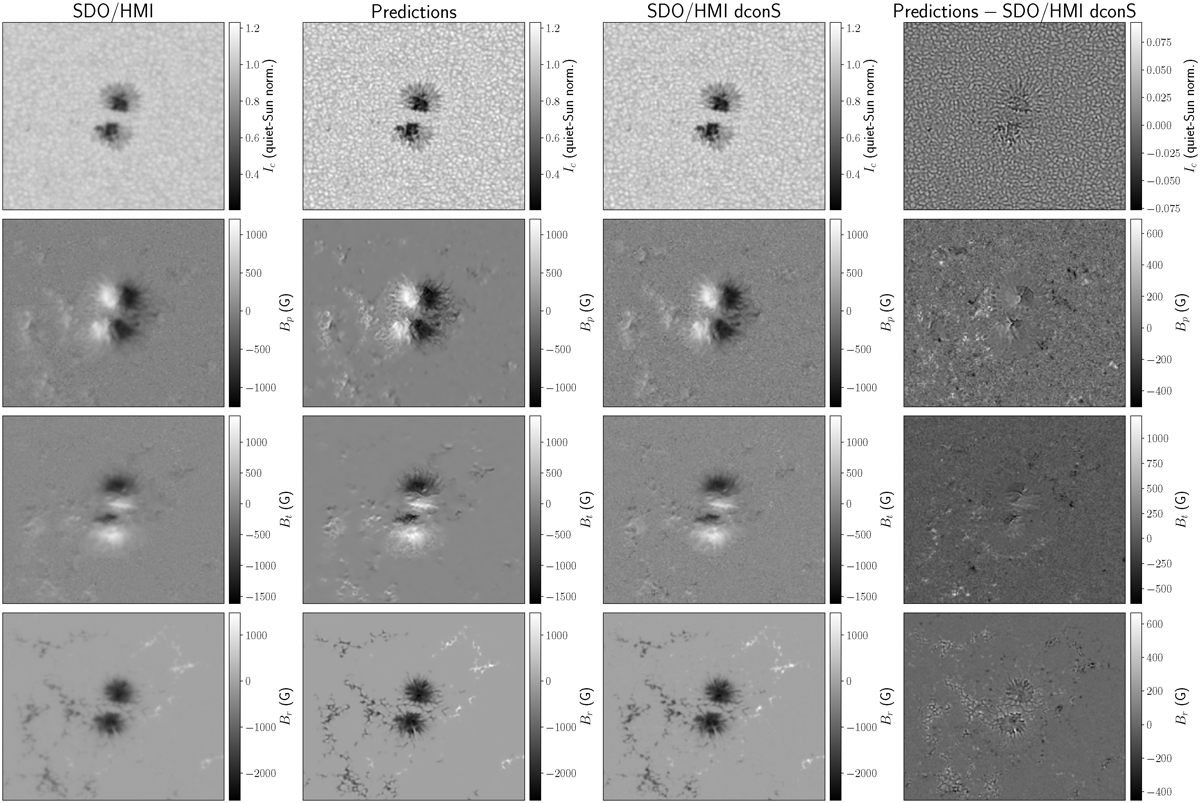
Comparison of the HMI deconvolution pipeline and CNN-based modelled deconvolution. Top to bottom: Intensity, zonal magnetic field, azimuthal magnetic field, and radial magnetic field. Left to right: SDO/HMI observations of active region AR 12797 at 12:00 UT on 23 January 2021, CNN-deconvolved results, HMI_dconS-deconvolved results, and the difference between the CNN and HMI_dconS deconvolution results. The colour scales are the same for the first three panels within each row, while the right-most panel in each row has a distinct colour scale.
Current usage metrics show cumulative count of Article Views (full-text article views including HTML views, PDF and ePub downloads, according to the available data) and Abstracts Views on Vision4Press platform.
Data correspond to usage on the plateform after 2015. The current usage metrics is available 48-96 hours after online publication and is updated daily on week days.
Initial download of the metrics may take a while.