Fig. 14.
Download original image
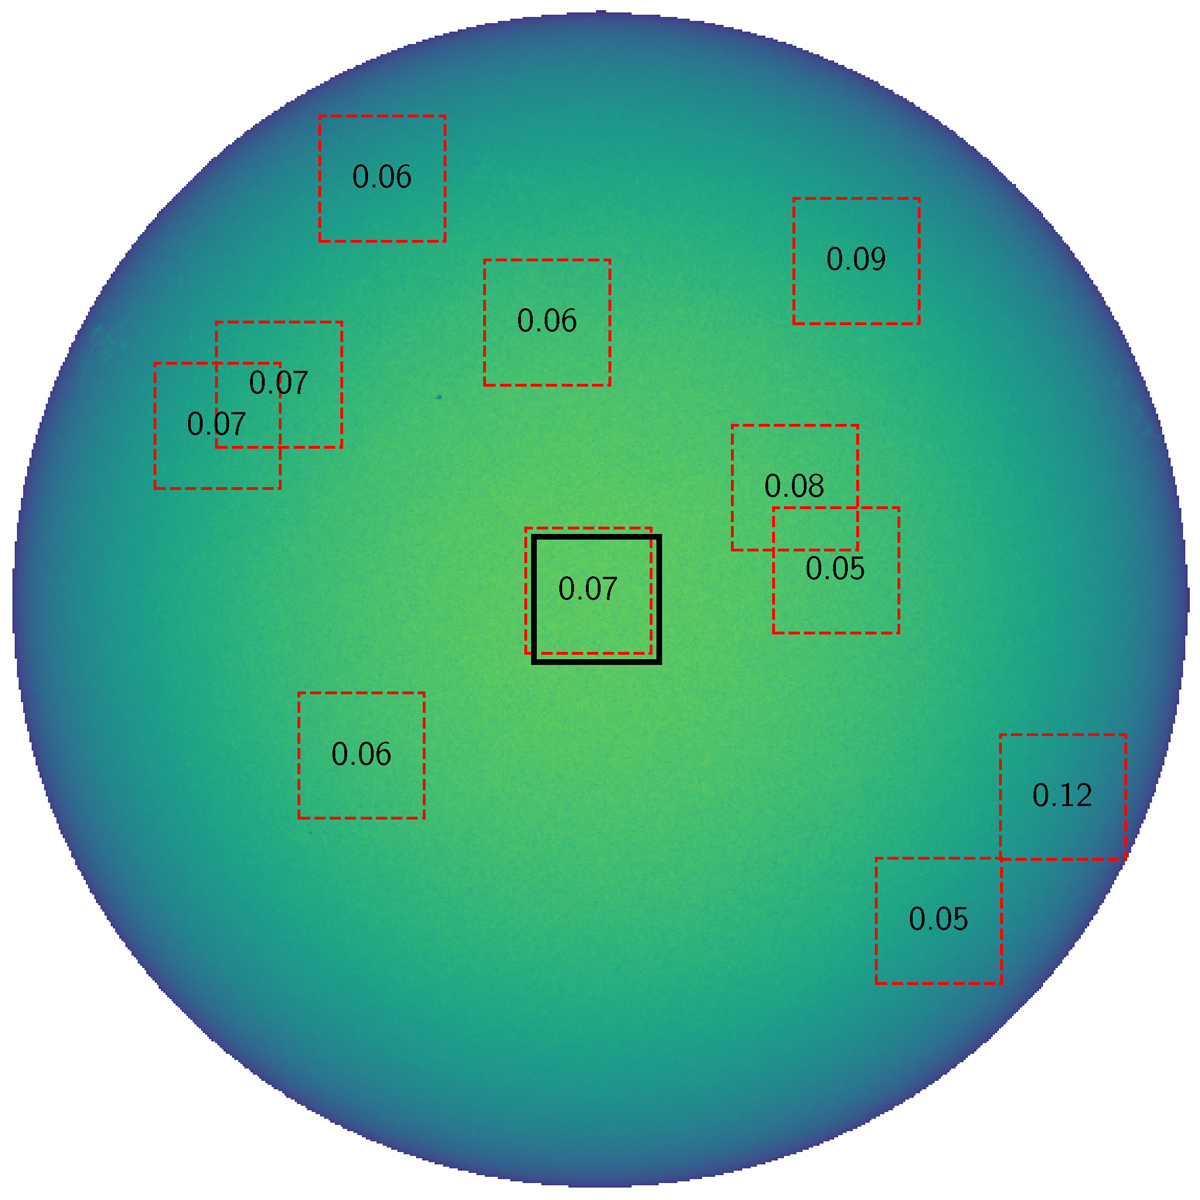
HMI continuum intensity observation at 19:00 UT on 5 May 2010. The red dashed patches outline regions where the computed PSF and the applied PSF differ by more than 0.05 in maximum unsigned value. Numerical values within the patches indicate the differences. The black patch shows the regions where the applied PSF was computed.
Current usage metrics show cumulative count of Article Views (full-text article views including HTML views, PDF and ePub downloads, according to the available data) and Abstracts Views on Vision4Press platform.
Data correspond to usage on the plateform after 2015. The current usage metrics is available 48-96 hours after online publication and is updated daily on week days.
Initial download of the metrics may take a while.