Open Access
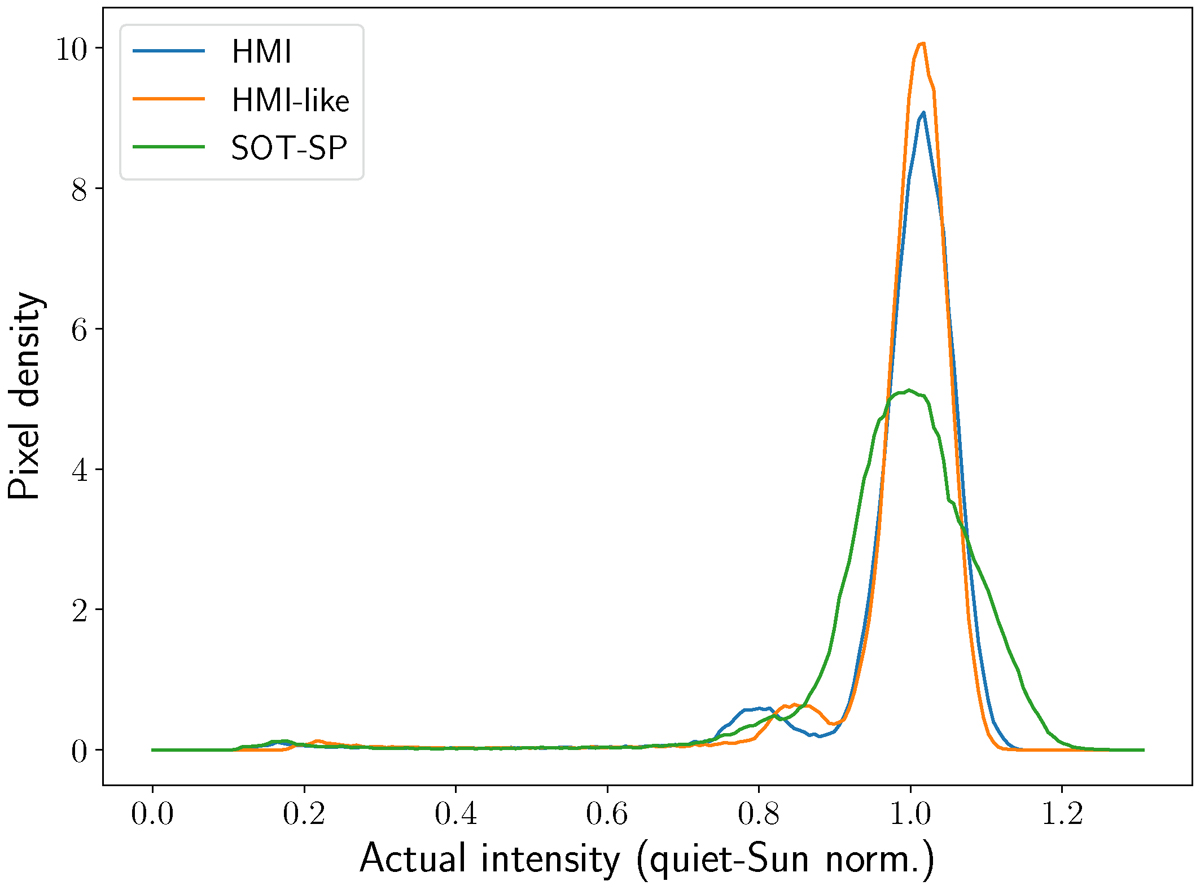
Fig. 13.
Download original image
Density kernel plot computed from intensity plotted in Fig. 1. The HMI and HMI-like distributions are comparable except for the penumbra region, which is close to 0.8 intensity. This may be due to multiple interpolations of the HMI observations during its alignment with SOT-SP observations.
Current usage metrics show cumulative count of Article Views (full-text article views including HTML views, PDF and ePub downloads, according to the available data) and Abstracts Views on Vision4Press platform.
Data correspond to usage on the plateform after 2015. The current usage metrics is available 48-96 hours after online publication and is updated daily on week days.
Initial download of the metrics may take a while.