Fig. 6.
Download original image
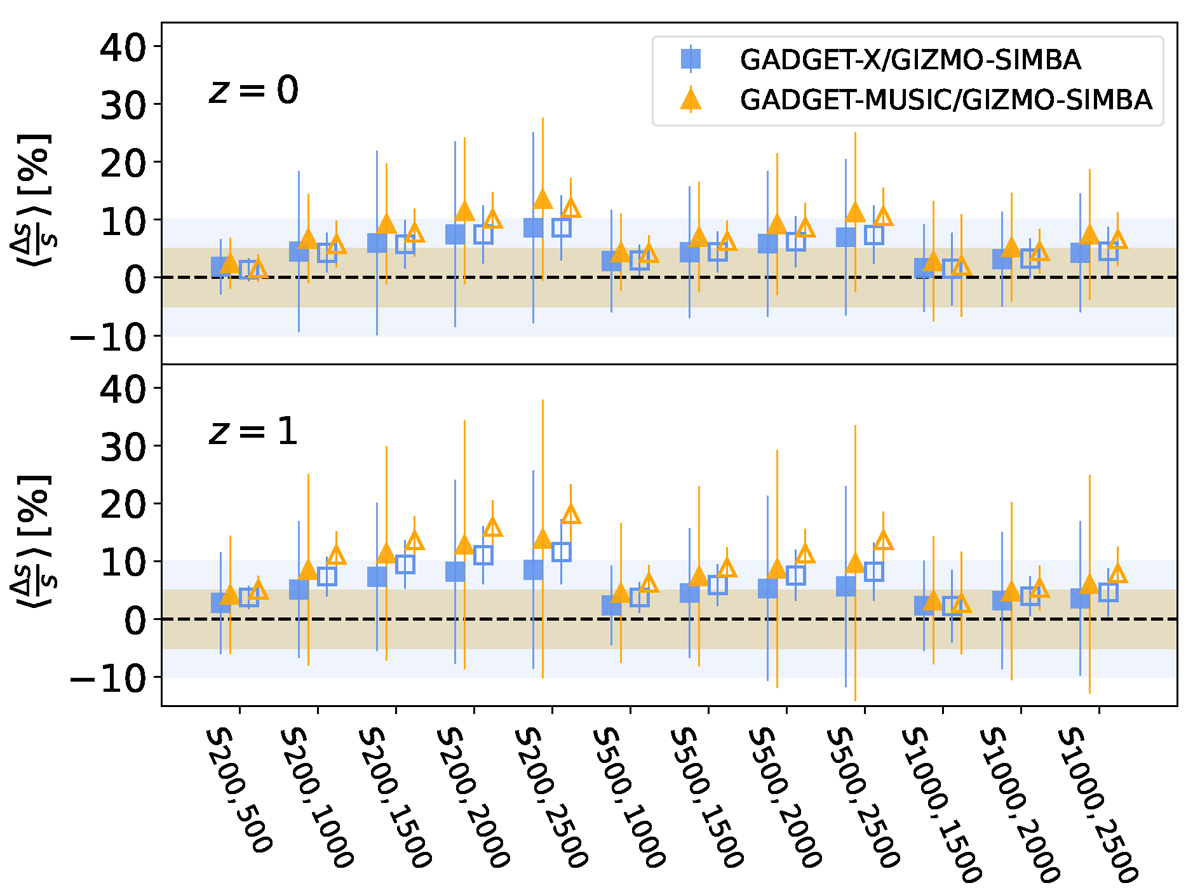
Average and scatter of the relative difference of the sparsity of the GADGET-X (blue squares) and GADGET-MUSIC (yellow triangles) clusters with respect to that of their GIZMO-SIMBA counterparts for different sparsity configurations in the case of the full (filled markers) and relaxed (empty markers) samples at z = 0 (top panel) and 1 (bottom panel), respectively. The errorbars represent the standard deviations for each sparsity configuration, while the shaded areas correspond to 5% and 10% variation respectively.
Current usage metrics show cumulative count of Article Views (full-text article views including HTML views, PDF and ePub downloads, according to the available data) and Abstracts Views on Vision4Press platform.
Data correspond to usage on the plateform after 2015. The current usage metrics is available 48-96 hours after online publication and is updated daily on week days.
Initial download of the metrics may take a while.