Fig. 3.
Download original image
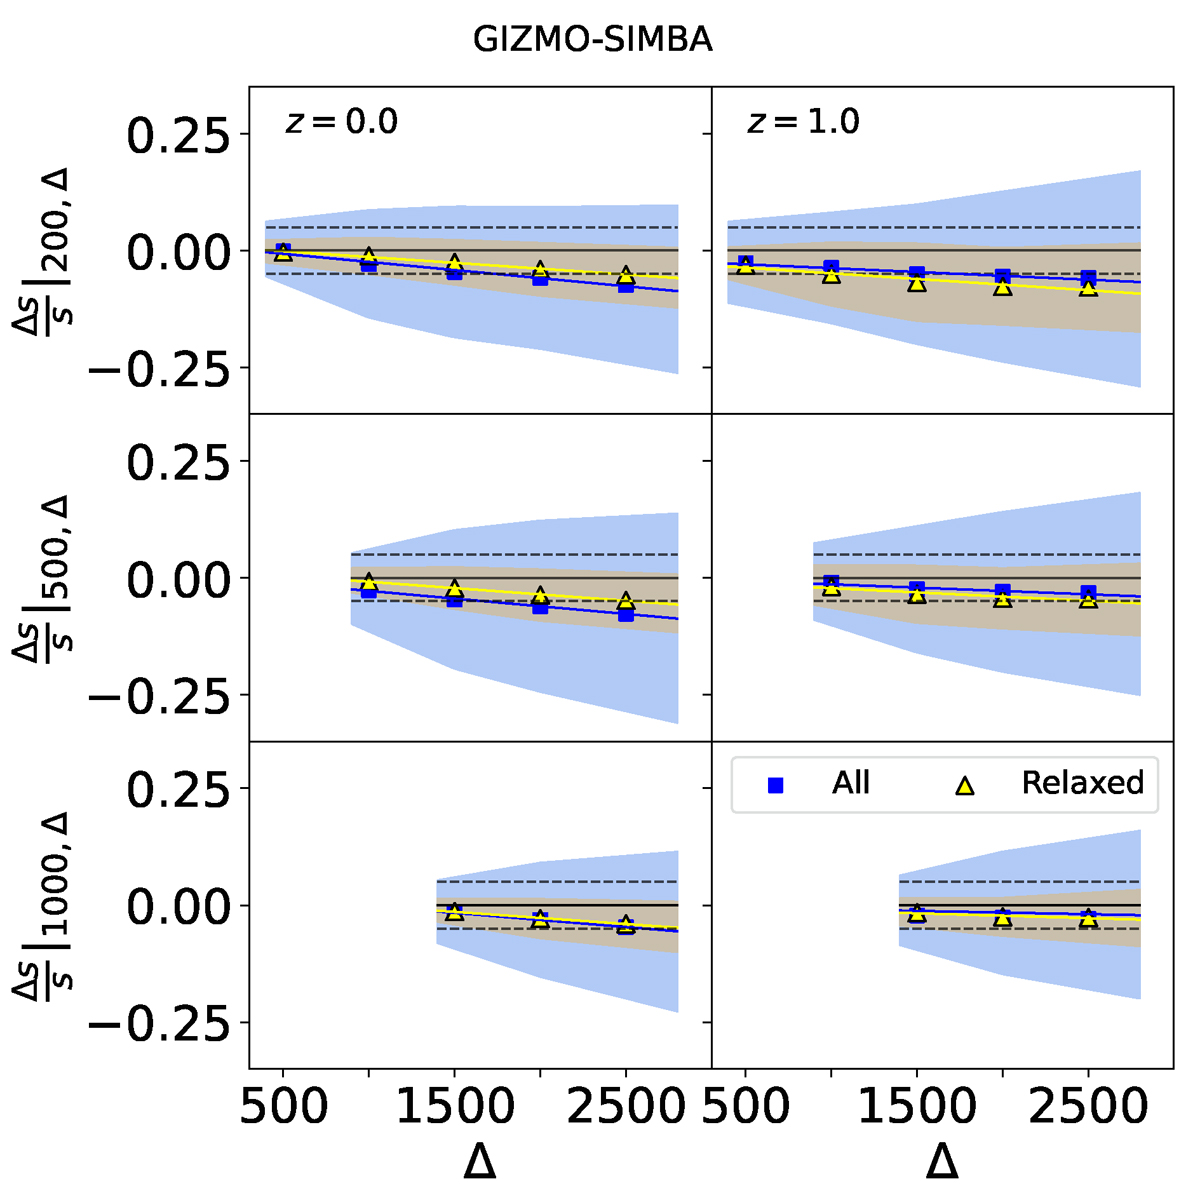
Sparsity relative difference Δs/s |200, Δ (top panels), Δs/s |500, Δ (central panels), and Δs/s |1000, Δ (bottom panels) as function of Δ for the GIZMO-SIMBA clusters in the catalogues at z = 0 (left panels) and 1 (right panels). The blue squares (yellow triangles) represent the average for the full (relaxed) cluster sample, while the shaded areas correspond to the standard deviation. The black dashed lines in the plots mark the 5% differences respectively, while the solid blue (yellow) lines correspond to the linear regression of the average values.
Current usage metrics show cumulative count of Article Views (full-text article views including HTML views, PDF and ePub downloads, according to the available data) and Abstracts Views on Vision4Press platform.
Data correspond to usage on the plateform after 2015. The current usage metrics is available 48-96 hours after online publication and is updated daily on week days.
Initial download of the metrics may take a while.