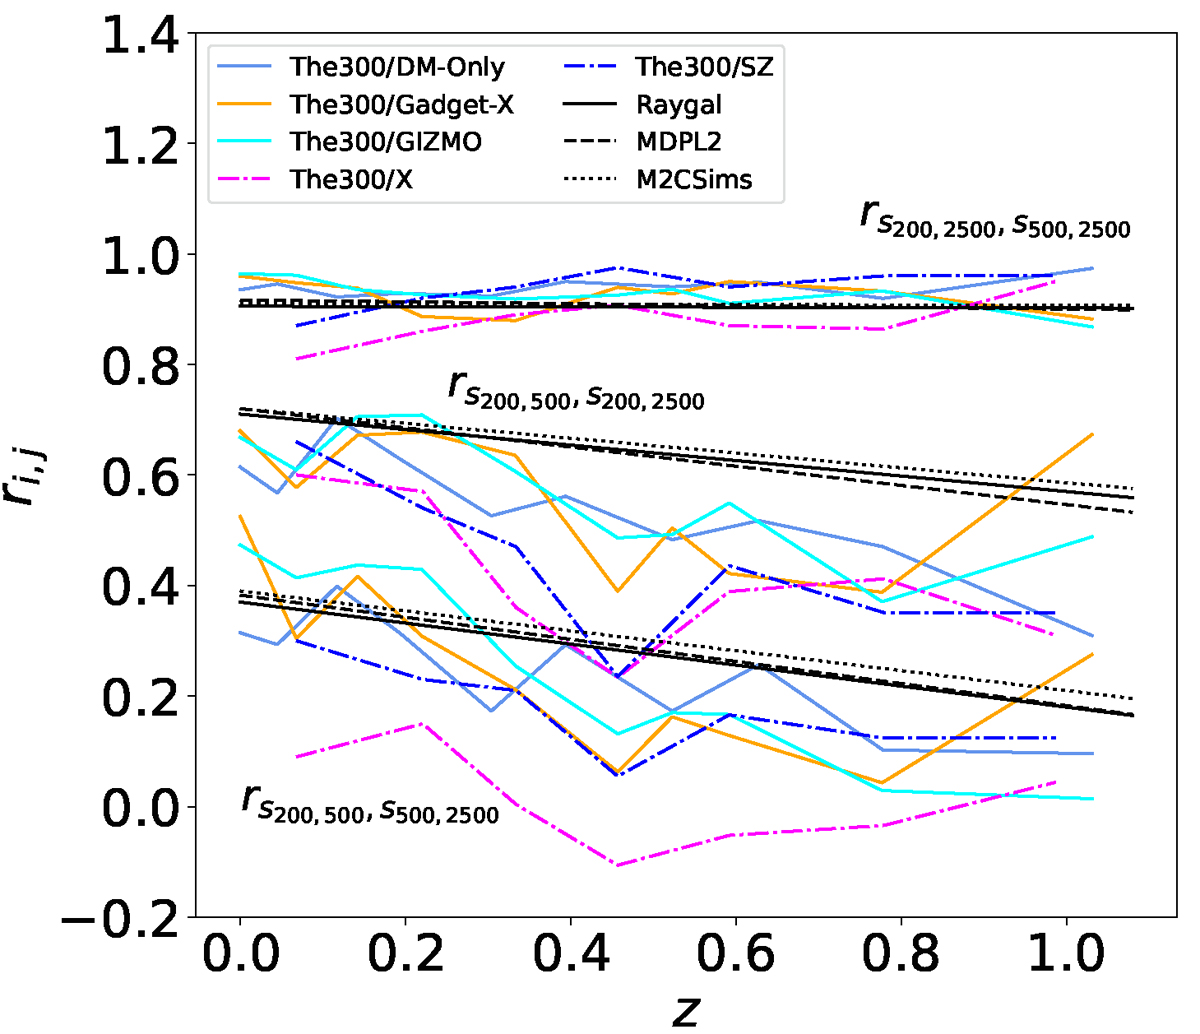
Fig. D.2.
Download original image
Correlation coefficients of the different sparsity pairs s200, 500 − s500, 2500 (lowest curves), s200, 500 − s200, 2500 (middle curves), s200, 2500 − s500, 2500 (top curves) as a function of redshifts from the DM-only (solid light-blue line), GADGET-X (solid orange line), MDPL2 (dashed red line), Raygal (solid blue line), and M2Csims (dotted green line) samples.
Current usage metrics show cumulative count of Article Views (full-text article views including HTML views, PDF and ePub downloads, according to the available data) and Abstracts Views on Vision4Press platform.
Data correspond to usage on the plateform after 2015. The current usage metrics is available 48-96 hours after online publication and is updated daily on week days.
Initial download of the metrics may take a while.