Fig. A.1.
Download original image
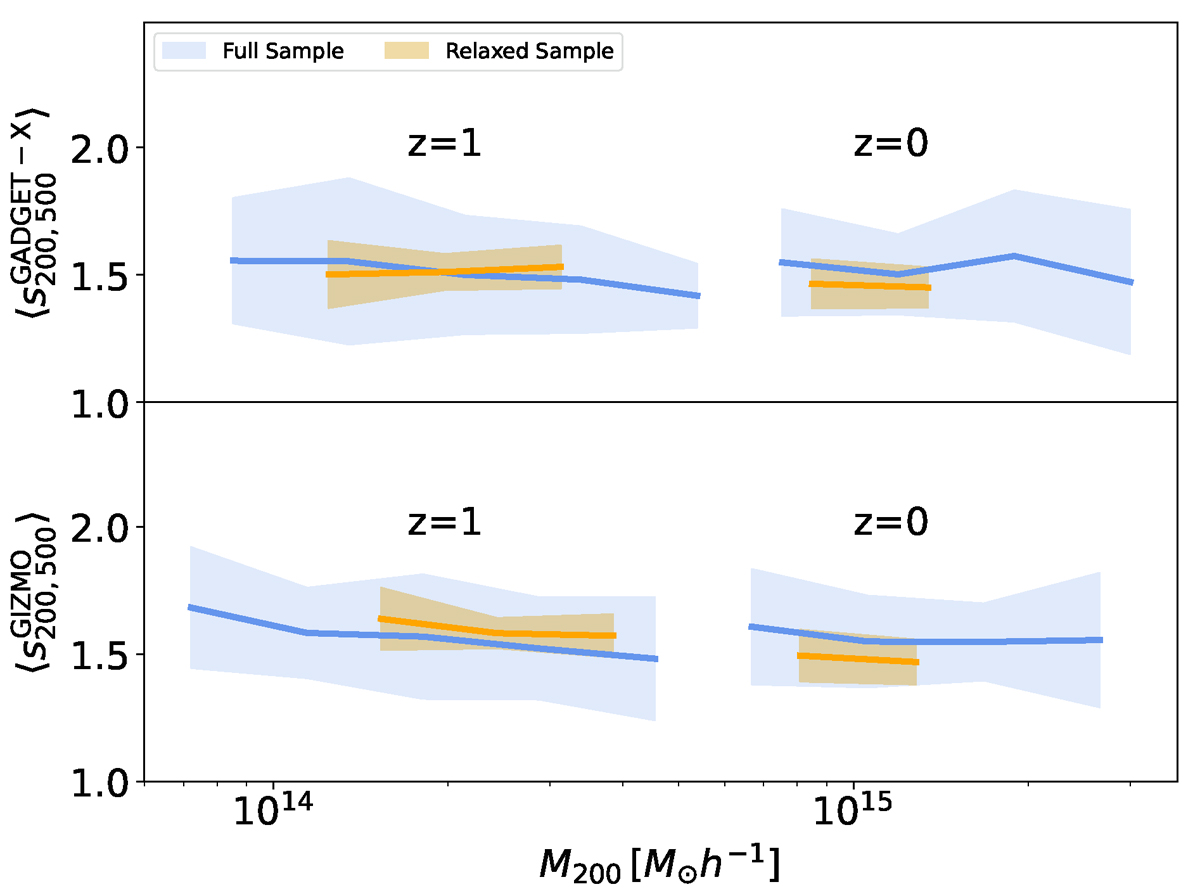
Average sparsity ⟨s200, 500⟩ as function of M200 for the clusters in the GADGET-X (top panel) and GIZMO-SIMBA (bottom panel) catalogues at z = 0 and 1, respectively. The blue solid line corresponds to the case of the full cluster sample, while the goldenrod solid line corresponds to the relaxed one. The shaded areas correspond to the standard deviation in each mass bin.
Current usage metrics show cumulative count of Article Views (full-text article views including HTML views, PDF and ePub downloads, according to the available data) and Abstracts Views on Vision4Press platform.
Data correspond to usage on the plateform after 2015. The current usage metrics is available 48-96 hours after online publication and is updated daily on week days.
Initial download of the metrics may take a while.