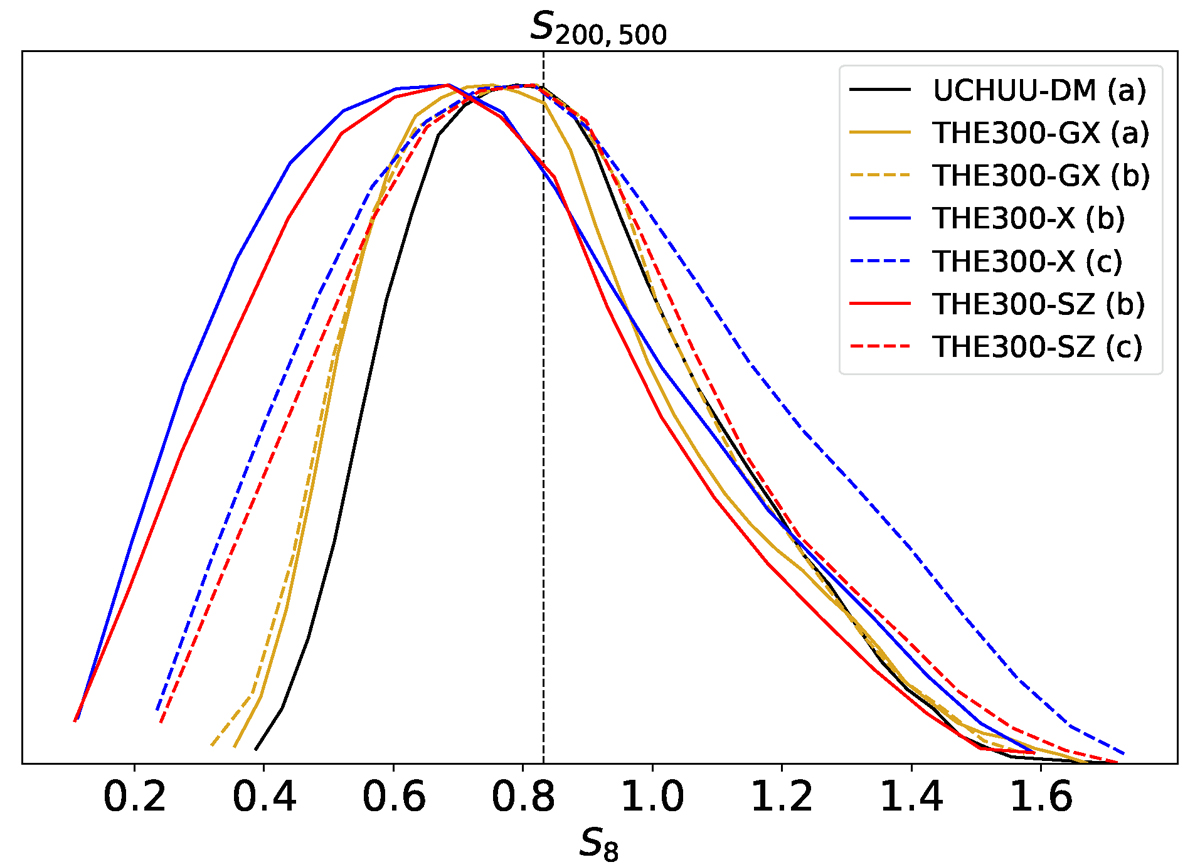
Fig. 17.
Download original image
Marginalised posterior on S8 from the analysis of single sparsity measurements for the UCHUU-DM (black curve), The300-GX (yellow curves), The300-X (blue curves) and The300-SZ (red curves). The solid lines represent posterior inferred with the simplest data model, while the dashed lines corresponds to posteriors obtained marginalising over bias model parameters.
Current usage metrics show cumulative count of Article Views (full-text article views including HTML views, PDF and ePub downloads, according to the available data) and Abstracts Views on Vision4Press platform.
Data correspond to usage on the plateform after 2015. The current usage metrics is available 48-96 hours after online publication and is updated daily on week days.
Initial download of the metrics may take a while.