Fig. 4
Download original image
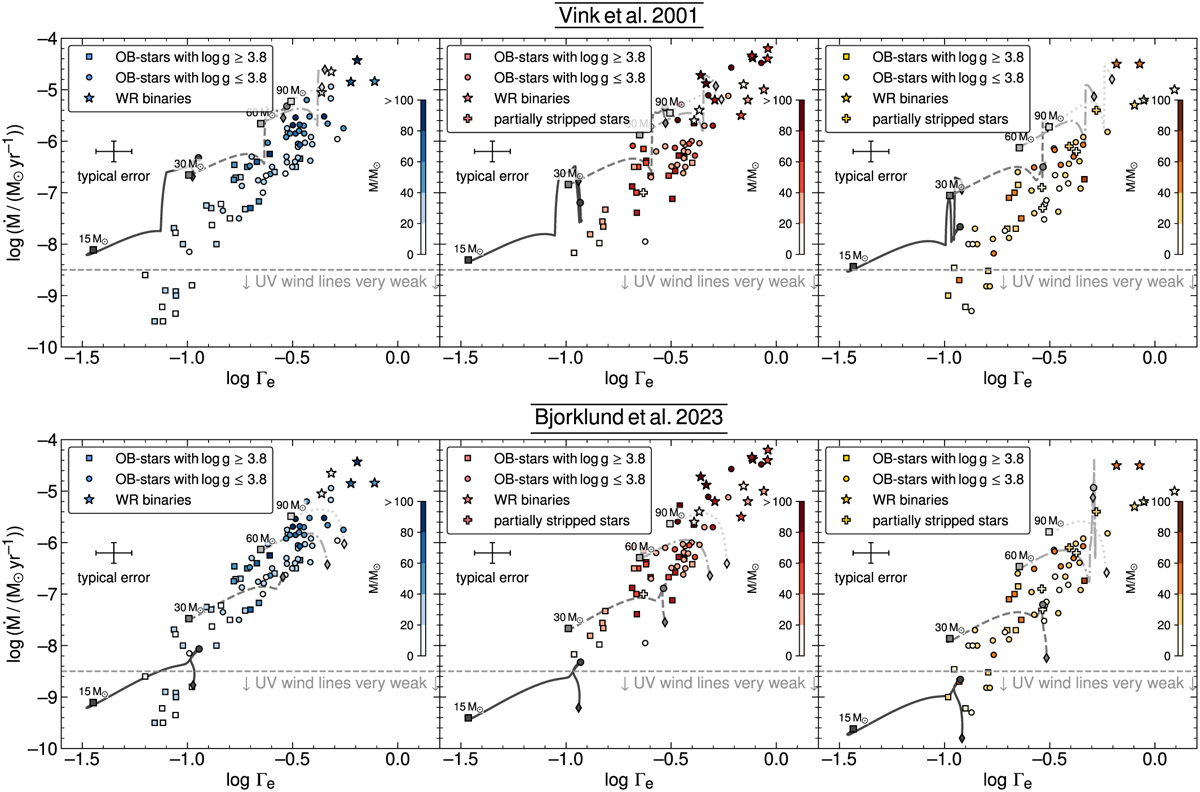
Mass-loss rates of stars in the Galaxy (left), LMC (middle), and SMC (right) as a function of the Eddington parameter. The discrete symbols indicate stars from different spectral classes. The symbols are color-coded according to a star’s current mass. To enable a comparison to different mass-loss recipes (different rows) that do not have a direct dependence on Γe, we calculated stellar evolution models that predict how Γe changes during a star’s evolution. Lines indicate how ![]() and Γe change in the stellar evolution models with initial masses of Mini = 15 M⊙ (solid line), 30 M⊙ (dashed line), 60 M⊙ (dash-dotted line), and 90 M⊙ (dotted line) using different mass-loss recipes. The models shown here are calculated until either the surface hydrogen abundance drops below XH < 0.7 (i.e., when the models would interpolate between MS and WR wind) or until a temperature below T < 12 kK (i.e., when the models would switch to an RSG wind) is reached. Hence, these models should not be compared to the classical WR stars. The different symbols on the lines mark the zero-age main sequence (squares), the terminal-age main sequence (circles), and the aforementioned stopping criterion (diamond).
and Γe change in the stellar evolution models with initial masses of Mini = 15 M⊙ (solid line), 30 M⊙ (dashed line), 60 M⊙ (dash-dotted line), and 90 M⊙ (dotted line) using different mass-loss recipes. The models shown here are calculated until either the surface hydrogen abundance drops below XH < 0.7 (i.e., when the models would interpolate between MS and WR wind) or until a temperature below T < 12 kK (i.e., when the models would switch to an RSG wind) is reached. Hence, these models should not be compared to the classical WR stars. The different symbols on the lines mark the zero-age main sequence (squares), the terminal-age main sequence (circles), and the aforementioned stopping criterion (diamond).
Current usage metrics show cumulative count of Article Views (full-text article views including HTML views, PDF and ePub downloads, according to the available data) and Abstracts Views on Vision4Press platform.
Data correspond to usage on the plateform after 2015. The current usage metrics is available 48-96 hours after online publication and is updated daily on week days.
Initial download of the metrics may take a while.