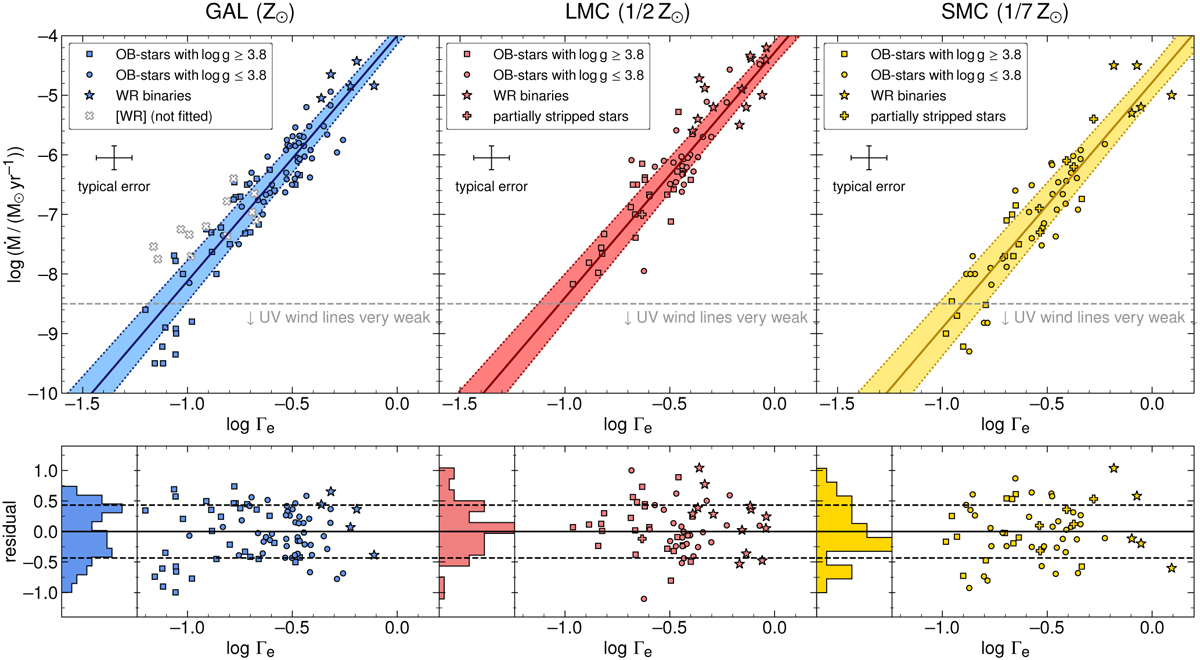
Fig. 3
Download original image
Upper: mass-loss rates of stars in the Galaxy (left), LMC (middle), and SMC (right) as a function of the Eddington parameter. The symbols indicate stars from different evolutionary stages as indicated in the legend. Solid lines and the shaded areas mark the best fit and the uncertainty, respectively. For the Galactic sample, the central stars of planetary nebulae ([WR]) stars are shown, but since their mass is not known and fixed to an average mass of 0.6 M⊙ they are not included in the fit. Lower: residuals between the observed mass-loss rates and the best fit. A histogram illustrates the average spread around the mean value. Dashed lines indicate the 1σ root-mean-square dispersion from our fitting routine.
Current usage metrics show cumulative count of Article Views (full-text article views including HTML views, PDF and ePub downloads, according to the available data) and Abstracts Views on Vision4Press platform.
Data correspond to usage on the plateform after 2015. The current usage metrics is available 48-96 hours after online publication and is updated daily on week days.
Initial download of the metrics may take a while.