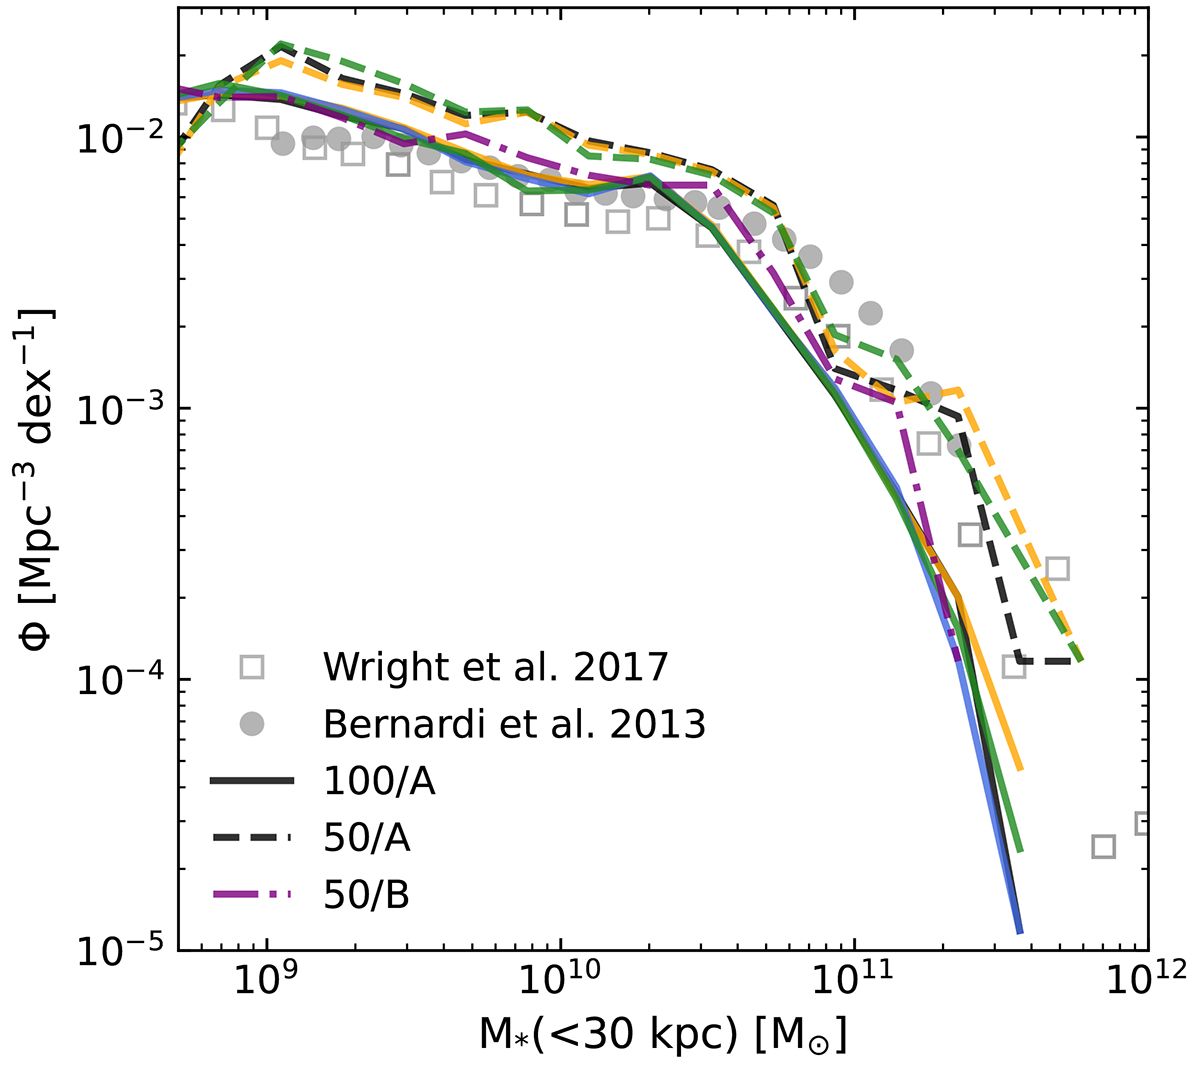
Fig. 9.
Download original image
Stellar mass function at z = 0. In each run, we consider the stellar mass measured within r = 30 kpc from the halo centre and qualitatively compare it to observations from SDSS (Bernardi et al. 2013) and GAMA (Wright et al. 2017). Solid and dashed lines represent the 100/A and 50/A runs, while we show the 50/B measurements (dot-dashed) only for the WDM1 scenarios. The colour scheme of the different dark matter models is the same as in Fig. 6.
Current usage metrics show cumulative count of Article Views (full-text article views including HTML views, PDF and ePub downloads, according to the available data) and Abstracts Views on Vision4Press platform.
Data correspond to usage on the plateform after 2015. The current usage metrics is available 48-96 hours after online publication and is updated daily on week days.
Initial download of the metrics may take a while.