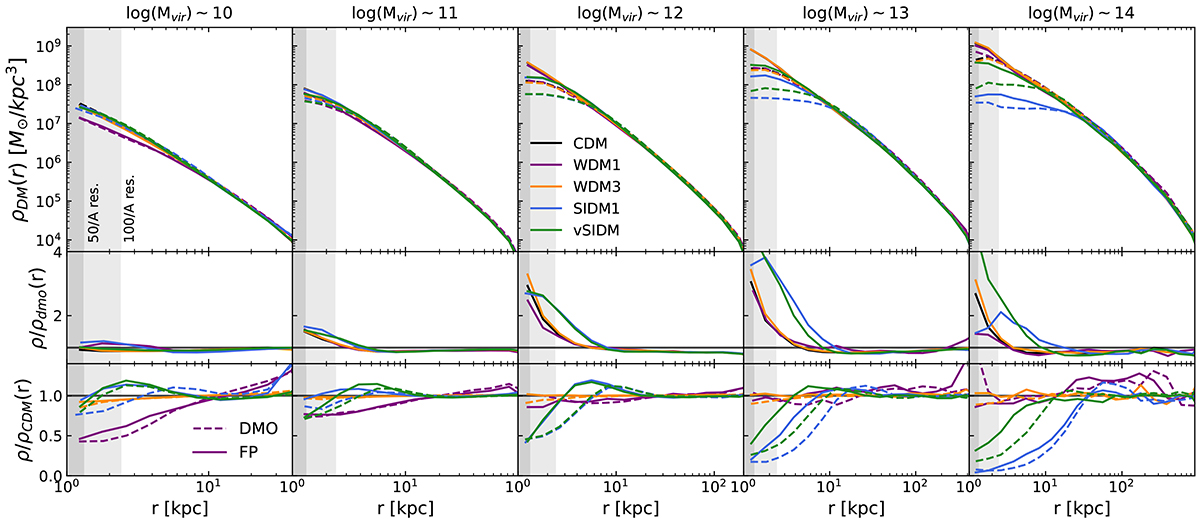
Fig. 10.
Download original image
Dark matter density profiles at z = 0 when considering five halo mass bins (left to right). We calculated the mean dark matter profile in bins of Δlog(Mvir) = 0.2 dex around the mean value, both in the FP (solid) and dark (dashed) runs. The profiles were calculated in logarithmically spaced spherical shells from 1 kpc to the halo virial radius. In order to capture both good statistics at high masses and the highest resolution, we average profiles from both the 50/A and 100/A runs for all models – except WDM1, where 50/B is employed. The small panels show (i) the ratio of each mean profile to its dark counterpart and (ii) to the CDM version. We observe an opposite trend in mass in the WDM and SIDM models. The latter creates larger density cores at high masses and cuspy profiles at Mvir≤1012 M⊙, while the former lowers the central density at low masses (halo masses below the half-mode mass Mhm). In all panels, the grey bands indicate 2.3ϵDM for both runs, which is often used as the minimum distance for reliable measurements.
Current usage metrics show cumulative count of Article Views (full-text article views including HTML views, PDF and ePub downloads, according to the available data) and Abstracts Views on Vision4Press platform.
Data correspond to usage on the plateform after 2015. The current usage metrics is available 48-96 hours after online publication and is updated daily on week days.
Initial download of the metrics may take a while.