Fig. 9
Download original image
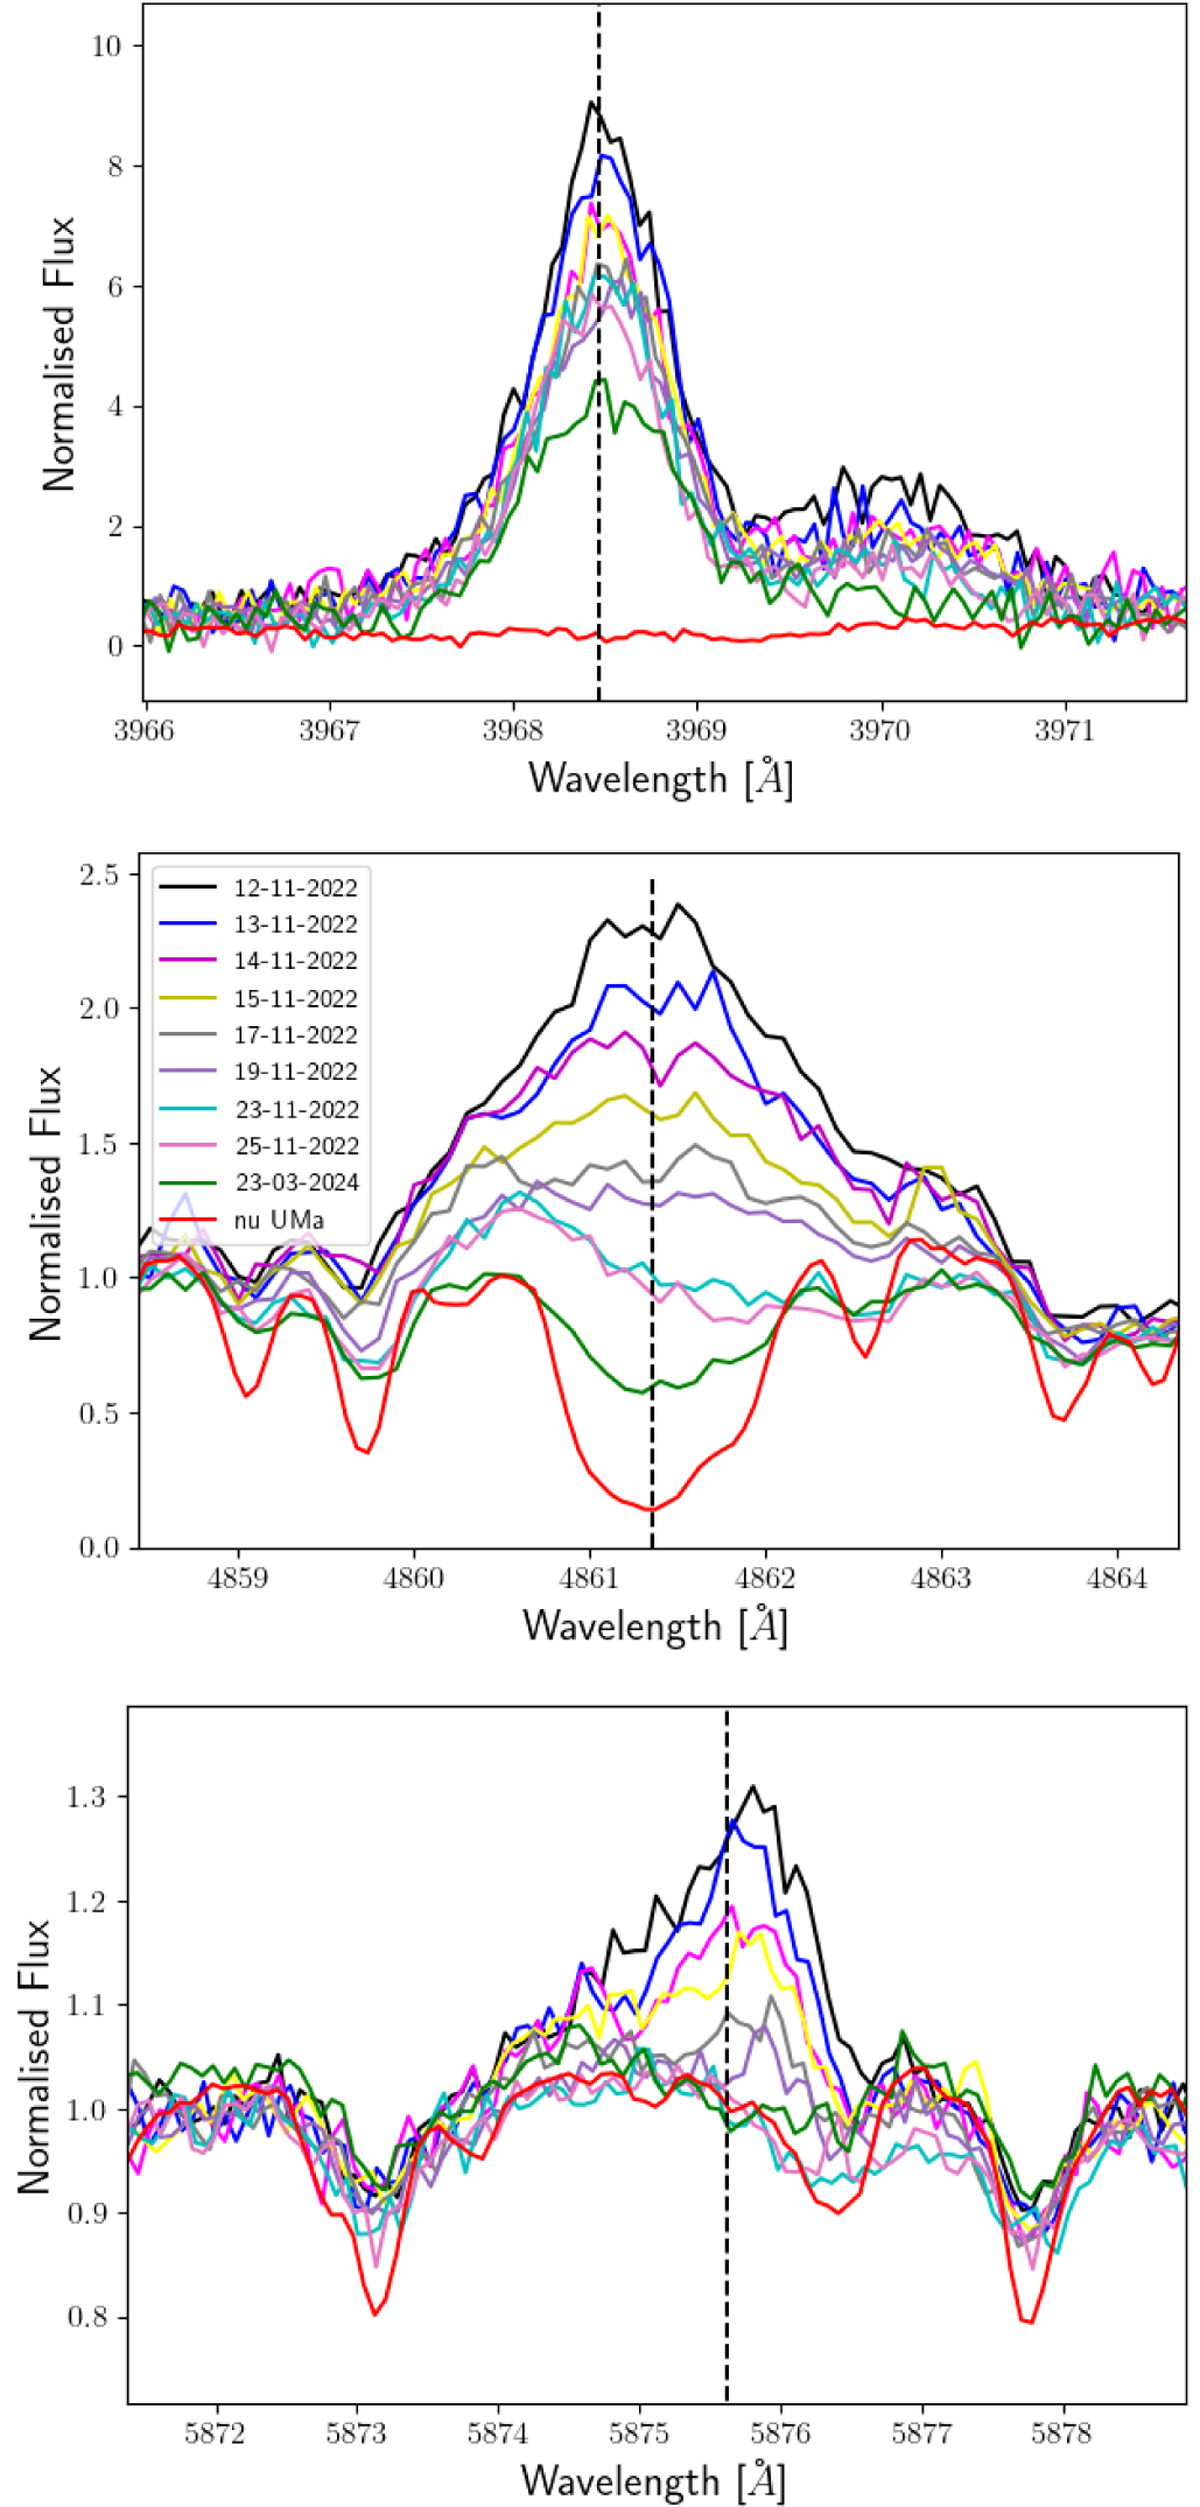
Line evolution of the Ca II H line and H ε (top), the H β line (middle), and the He I D3 line (bottom) during the large flare. The observation times for all spectra are given in the middle panel. For comparison, we include the spectrum with the smallest EW(H α) taken at 23-03-2024 and a spectrum of the inactive K3 giant v UMa for each shown line.
Current usage metrics show cumulative count of Article Views (full-text article views including HTML views, PDF and ePub downloads, according to the available data) and Abstracts Views on Vision4Press platform.
Data correspond to usage on the plateform after 2015. The current usage metrics is available 48-96 hours after online publication and is updated daily on week days.
Initial download of the metrics may take a while.