Open Access
Fig. 8
Download original image
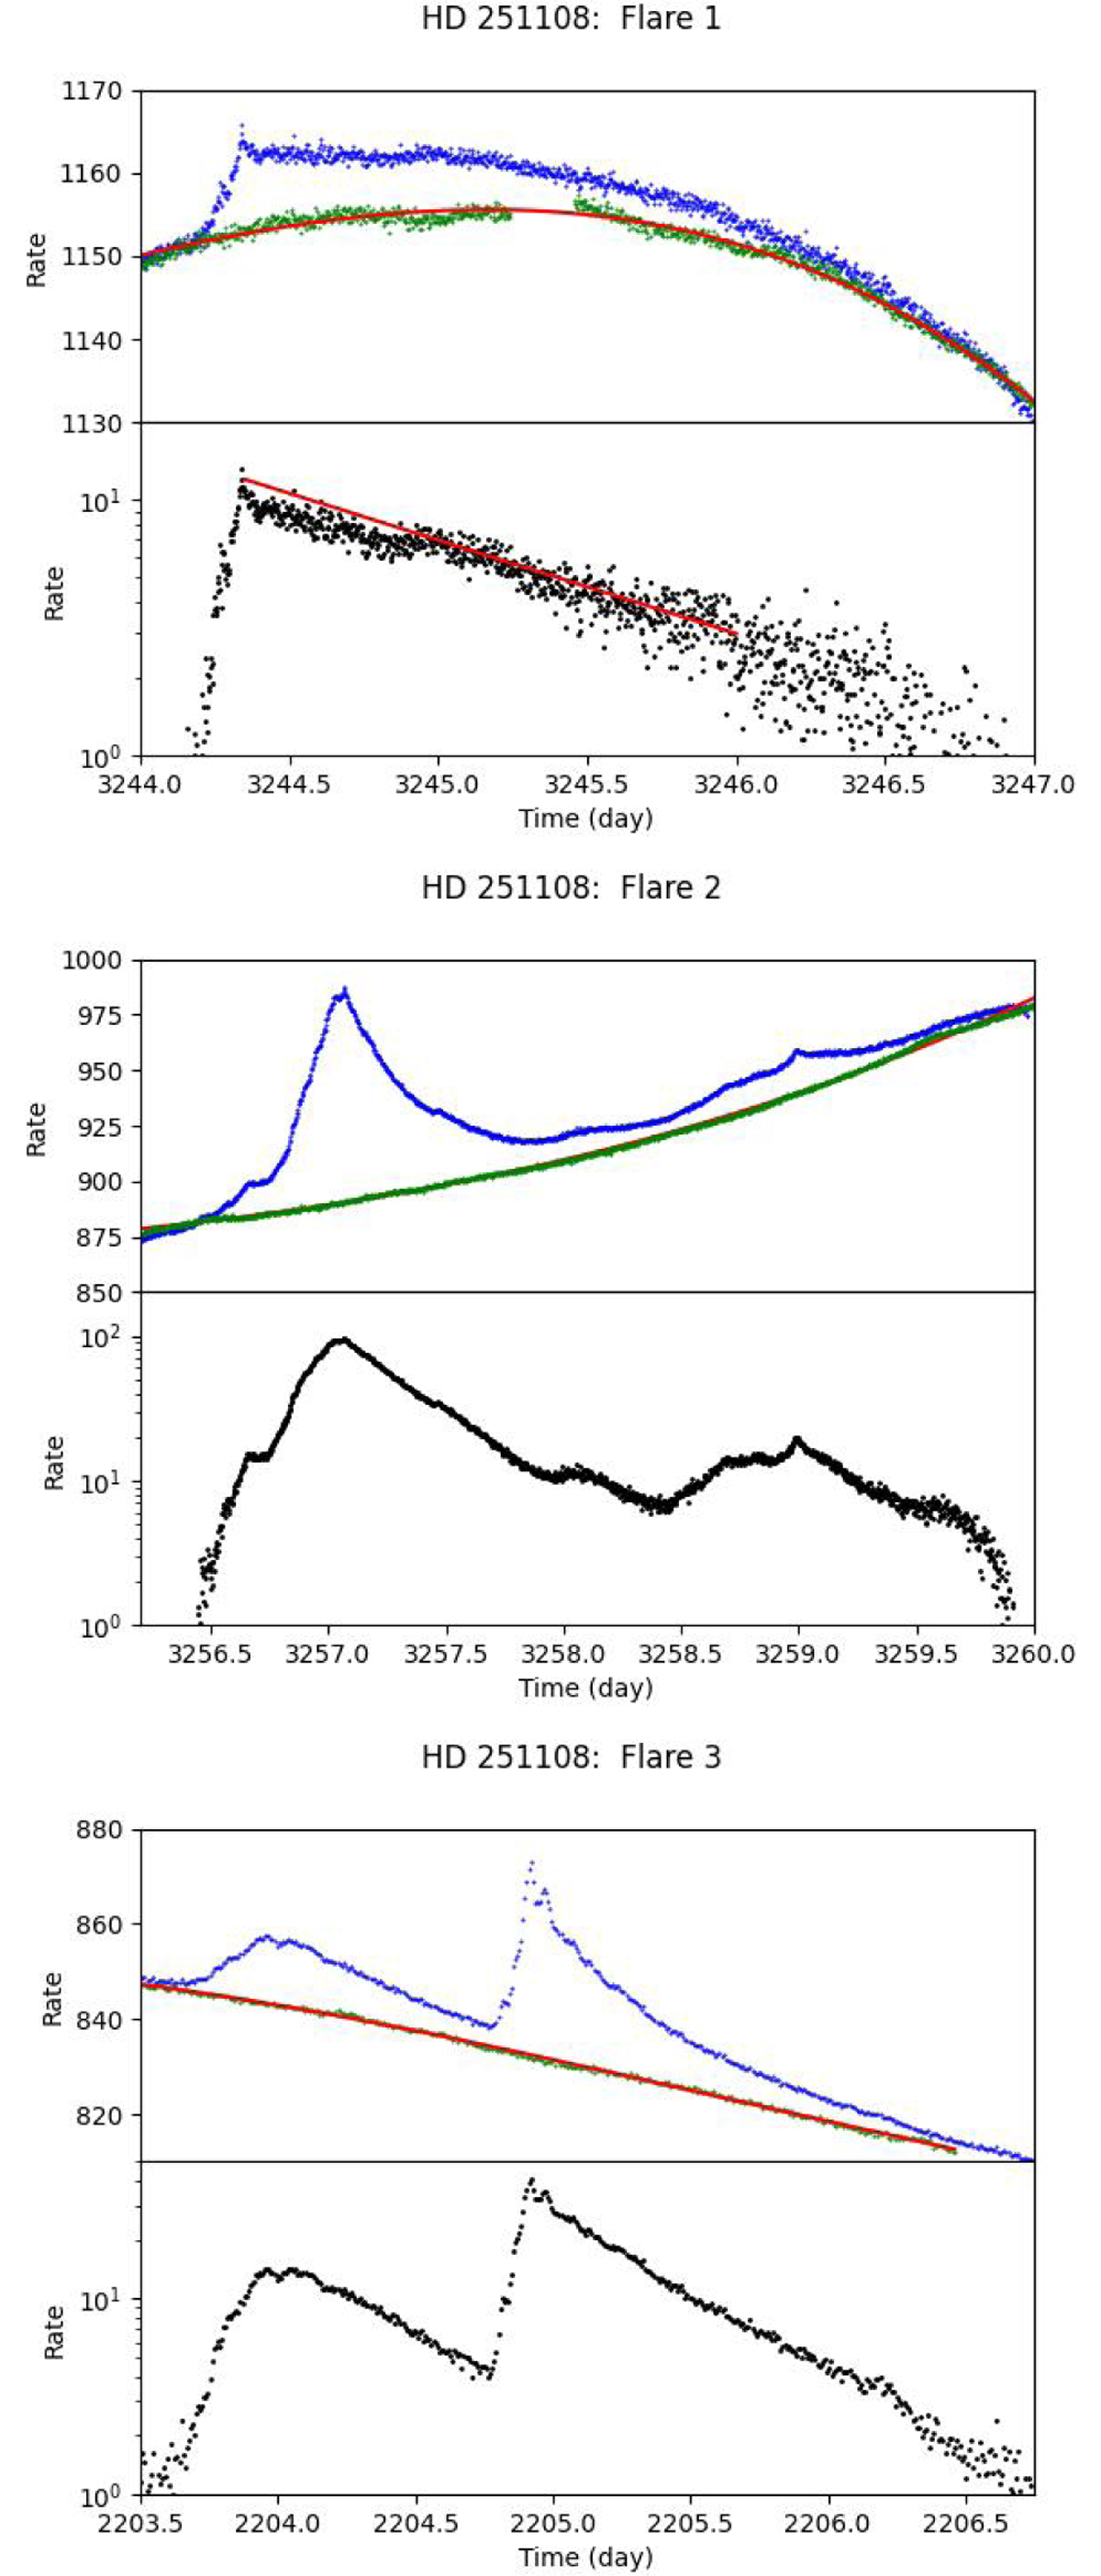
Flare light curves of the three flares: original data (blue points), reference data (light curve shifted backwards and forwards by one period; see text for details; green points) together with polynomial fit (solid red line), and net flare light curve (black points).
Current usage metrics show cumulative count of Article Views (full-text article views including HTML views, PDF and ePub downloads, according to the available data) and Abstracts Views on Vision4Press platform.
Data correspond to usage on the plateform after 2015. The current usage metrics is available 48-96 hours after online publication and is updated daily on week days.
Initial download of the metrics may take a while.