Open Access
Fig. 5
Download original image
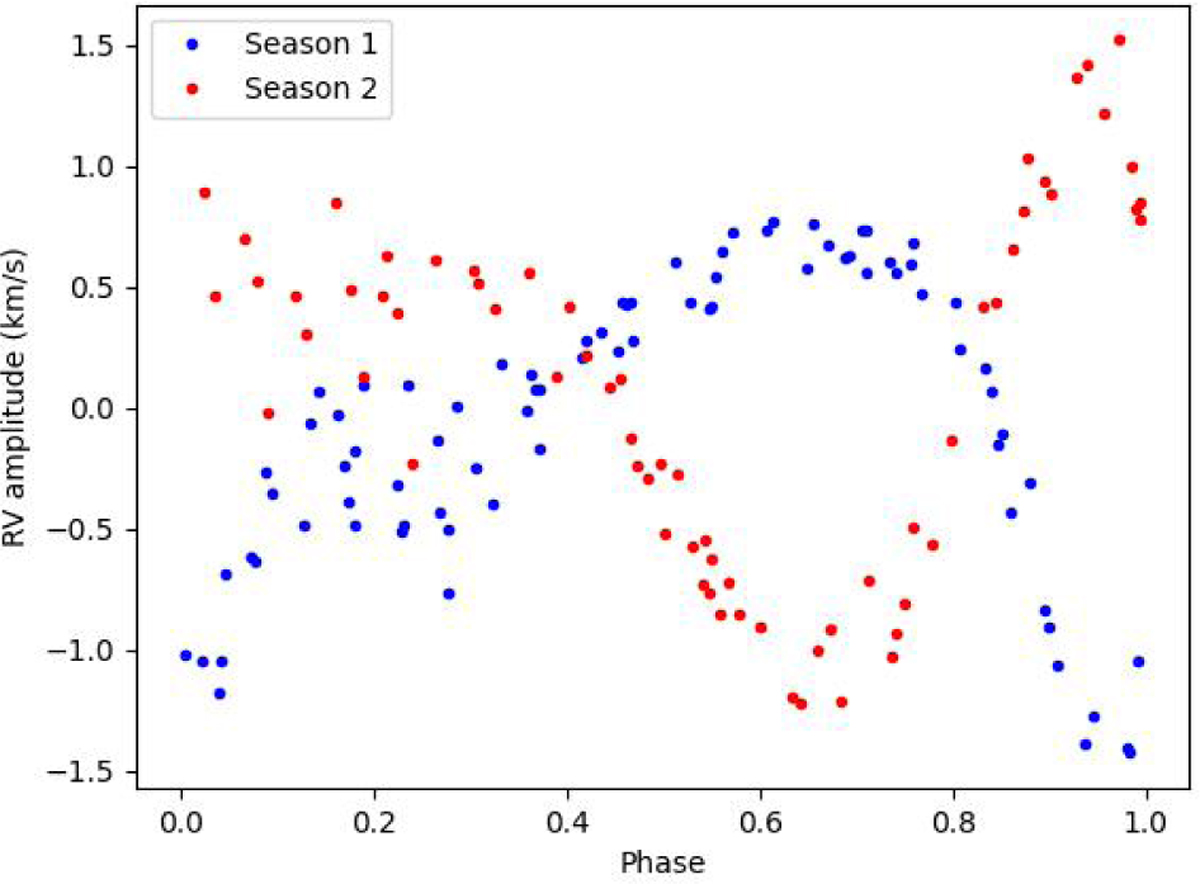
RV residuals to sinusoidal fit like in Fig. 4b, but phase-folded. We can notice strong spot migration and evolution from one season to the other. Also, there is more evolution in the second season.
Current usage metrics show cumulative count of Article Views (full-text article views including HTML views, PDF and ePub downloads, according to the available data) and Abstracts Views on Vision4Press platform.
Data correspond to usage on the plateform after 2015. The current usage metrics is available 48-96 hours after online publication and is updated daily on week days.
Initial download of the metrics may take a while.