Fig. 16
Download original image
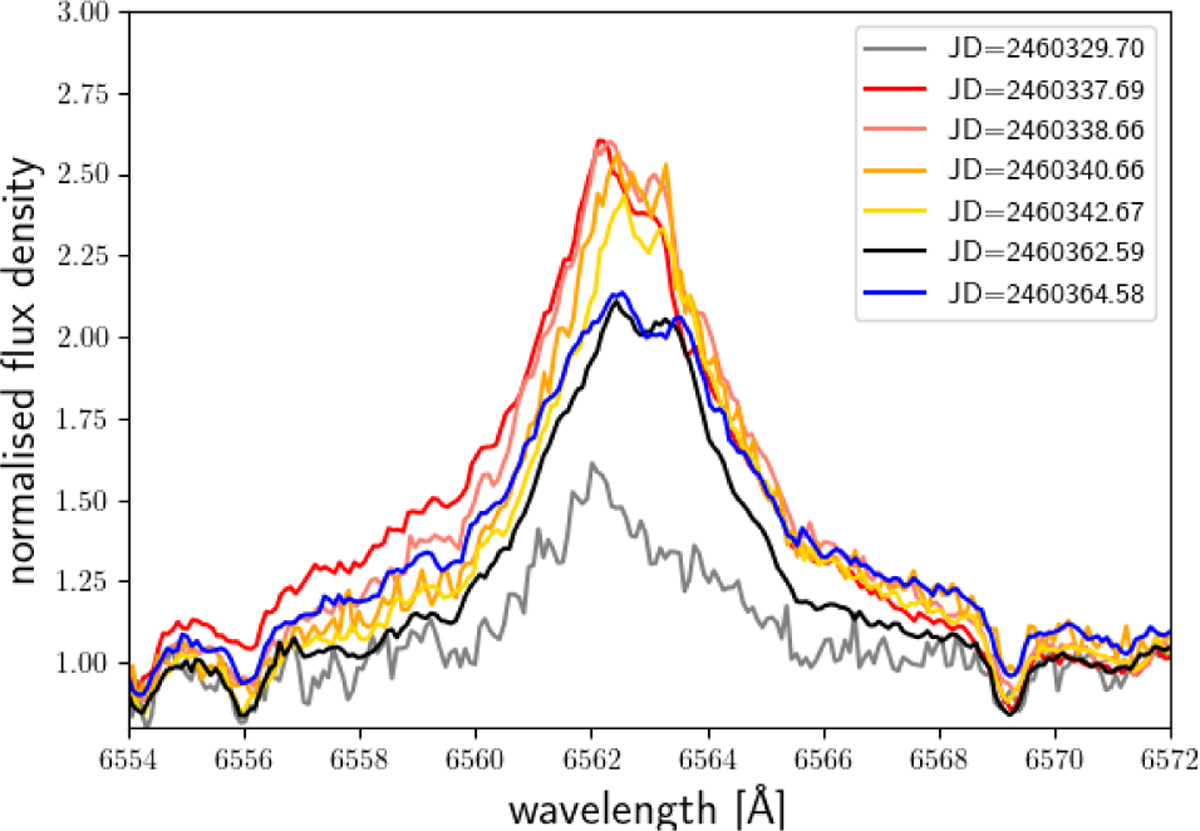
H α line shape for smaller flares in the second observing season. Shown are a spectrum of low activity level (grey), a spectrum of high activity level from the periodic behaviour (black) and the flare spectra from JD=2460337-2460342 days in red, salmon, orange, and yellow (with the first three spectra showing clearly enhanced EW(H α)), and the flare spectrum taken at JD=2460364 days (blue). For the sequence an enhancement and decay of the far blue wing can be noticed.
Current usage metrics show cumulative count of Article Views (full-text article views including HTML views, PDF and ePub downloads, according to the available data) and Abstracts Views on Vision4Press platform.
Data correspond to usage on the plateform after 2015. The current usage metrics is available 48-96 hours after online publication and is updated daily on week days.
Initial download of the metrics may take a while.