Fig. 10
Download original image
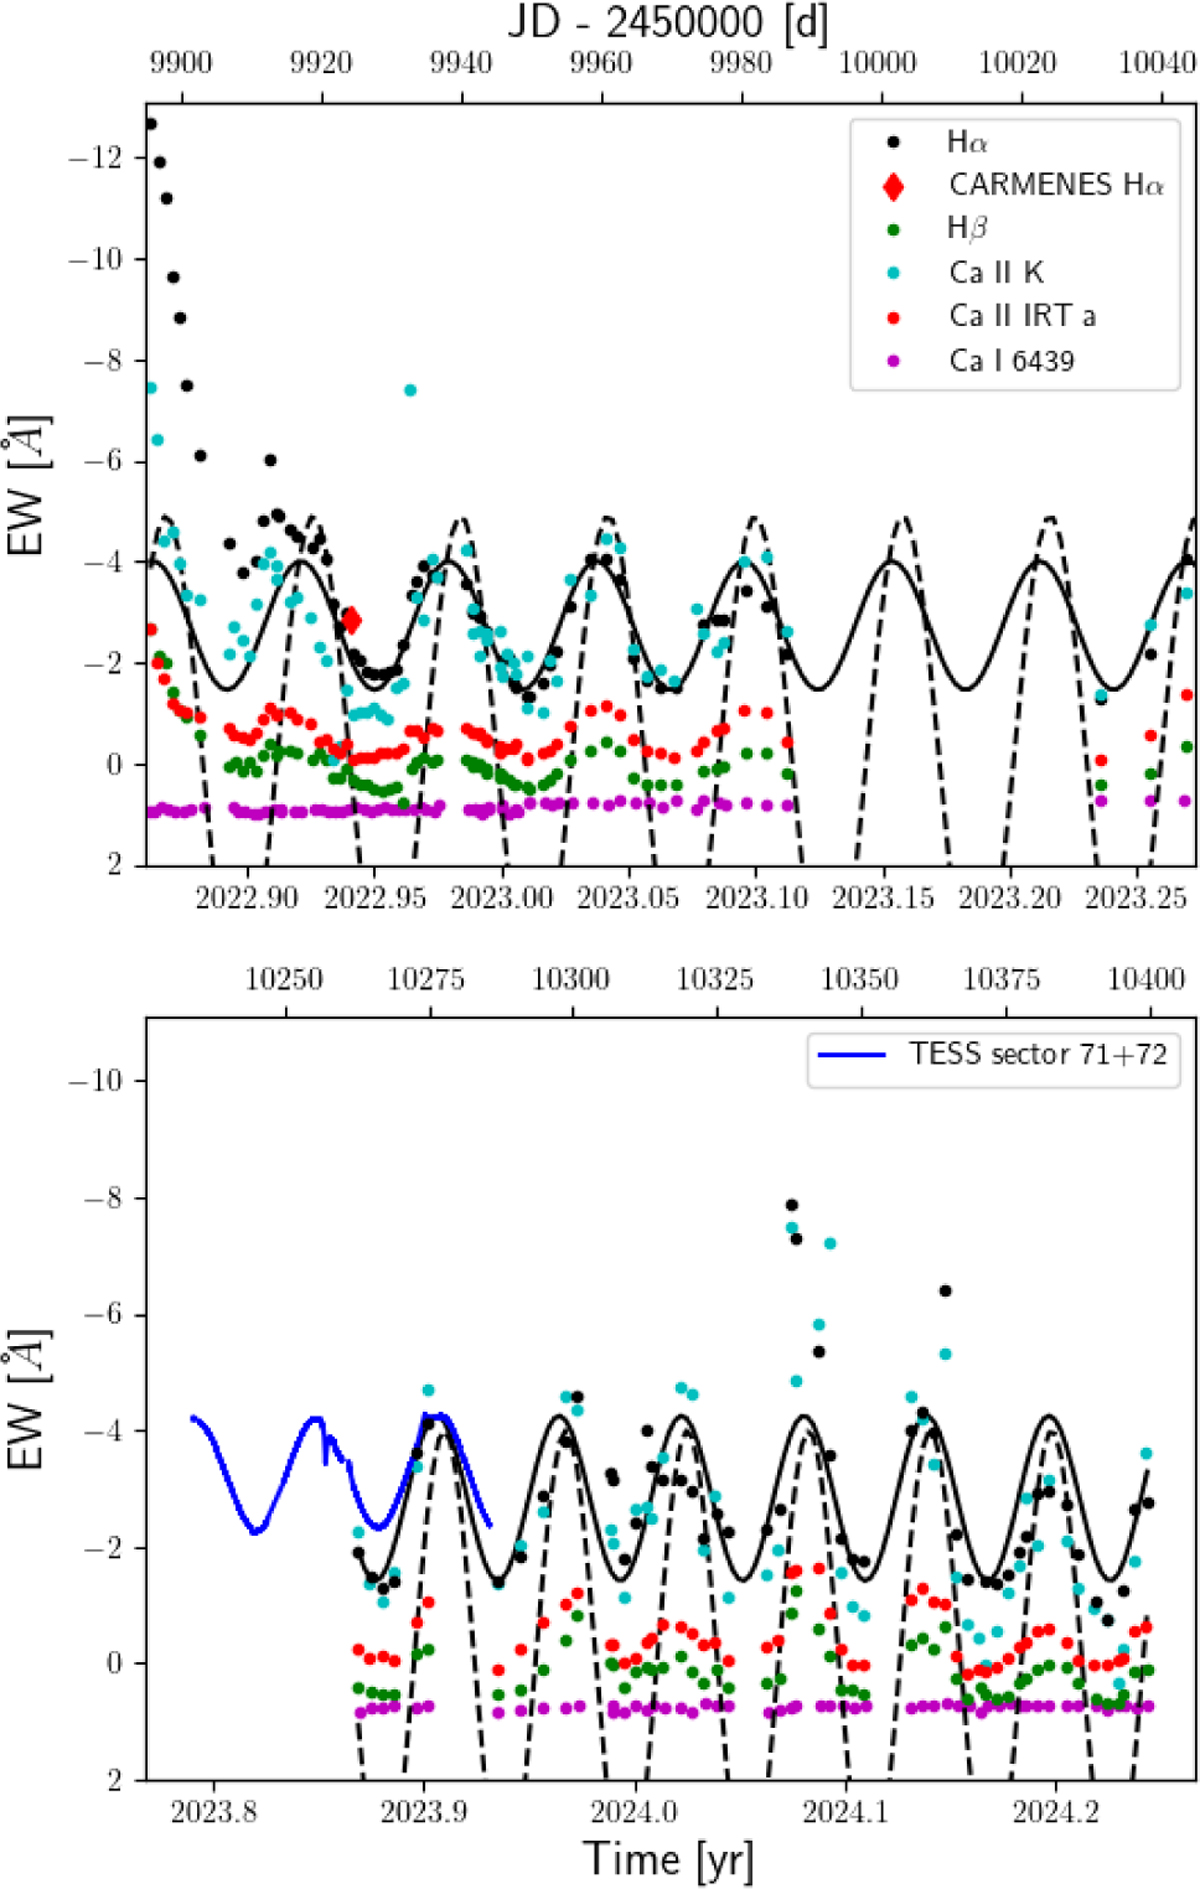
Time evolution of the EW of various lines as designated in the legend of the upper panel. Top: first observing season. Bottom: second observing season. We note, that the EW(Ca IRT) and the EW(Ca I) of the photospheric reference line have been scaled for better display by a factor of 2.5 each. Overplotted are as black solid line the sine fits to the EW(H α) values of the respective season, as dashed black line the sine fit to the RV values of the respective season, and in blue the TESS lightcurves of sector 71 and 72, which have been scaled by a factor of 0.007 and shifted for convenience. We also note that the TESS lightcurve has its maximum count rate for the smallest H α emission (and that therefore the flare displayed here in the TESS lightcurve is ’inverted’).
Current usage metrics show cumulative count of Article Views (full-text article views including HTML views, PDF and ePub downloads, according to the available data) and Abstracts Views on Vision4Press platform.
Data correspond to usage on the plateform after 2015. The current usage metrics is available 48-96 hours after online publication and is updated daily on week days.
Initial download of the metrics may take a while.