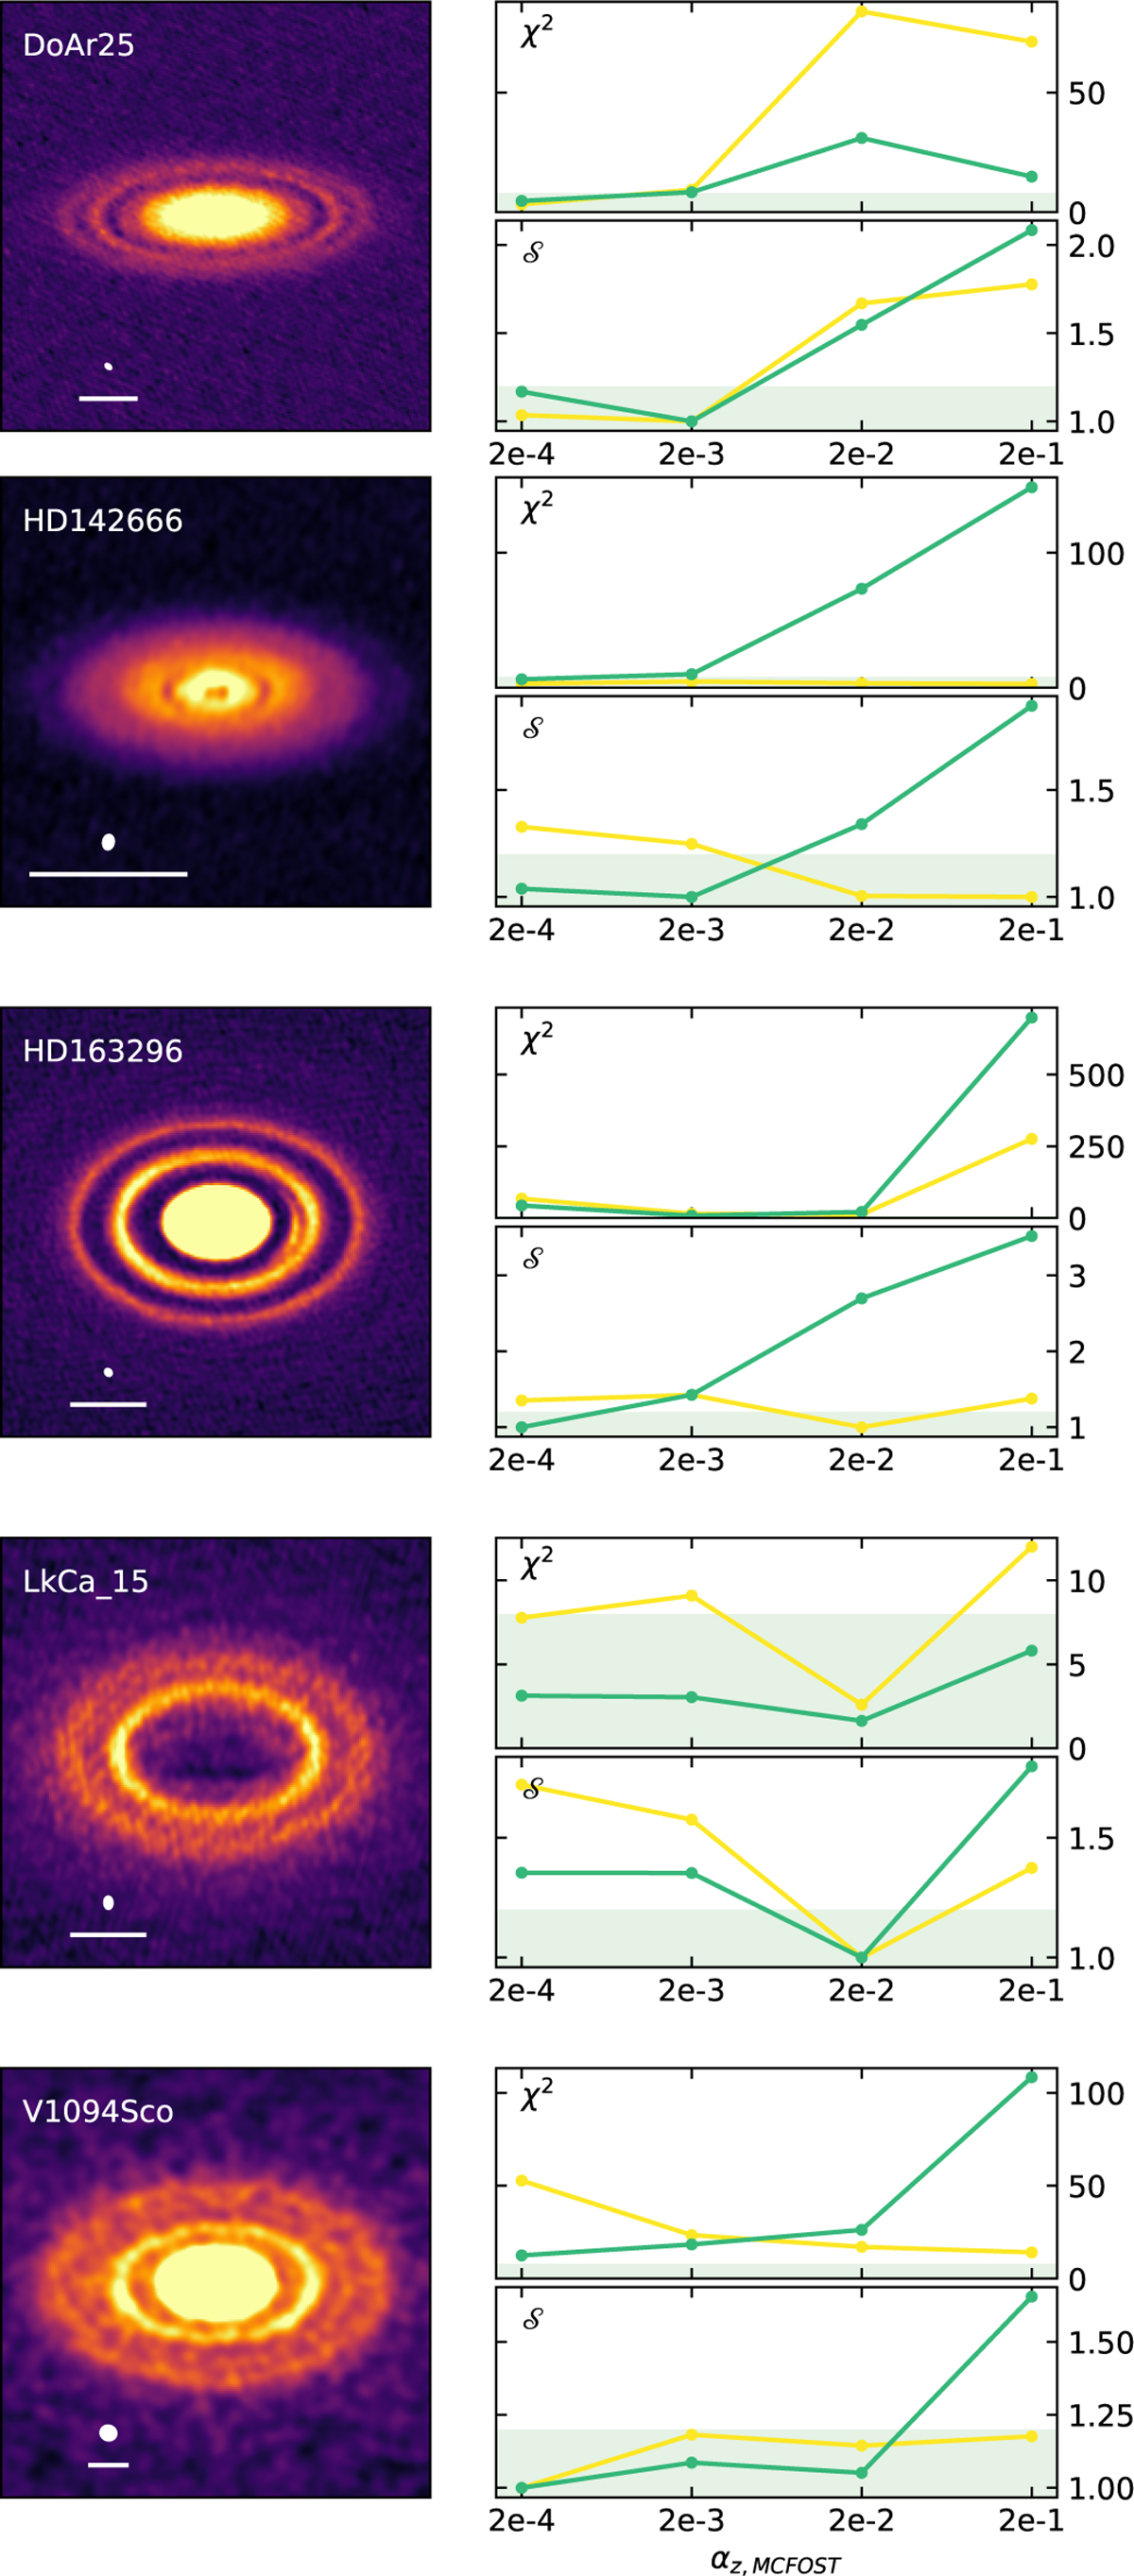
Fig. D.1
Download original image
Left: Data image, Right: Values for the χ2 and shape parameter 𝒮 (Sect. 3.4), quantifying the quality of the models. The green regions indicate that the models are generally good models. Yellow curves indicate results for the inner ring/region while green curves show that for the second ring/region. Major axis profiles highlighting the radial location of the different regions are shown in Fig. 3 and Fig. 4. The beam size and a 25 au scale are indicated in the bottom left corner of the first panels.
Current usage metrics show cumulative count of Article Views (full-text article views including HTML views, PDF and ePub downloads, according to the available data) and Abstracts Views on Vision4Press platform.
Data correspond to usage on the plateform after 2015. The current usage metrics is available 48-96 hours after online publication and is updated daily on week days.
Initial download of the metrics may take a while.