Fig. 7
Download original image
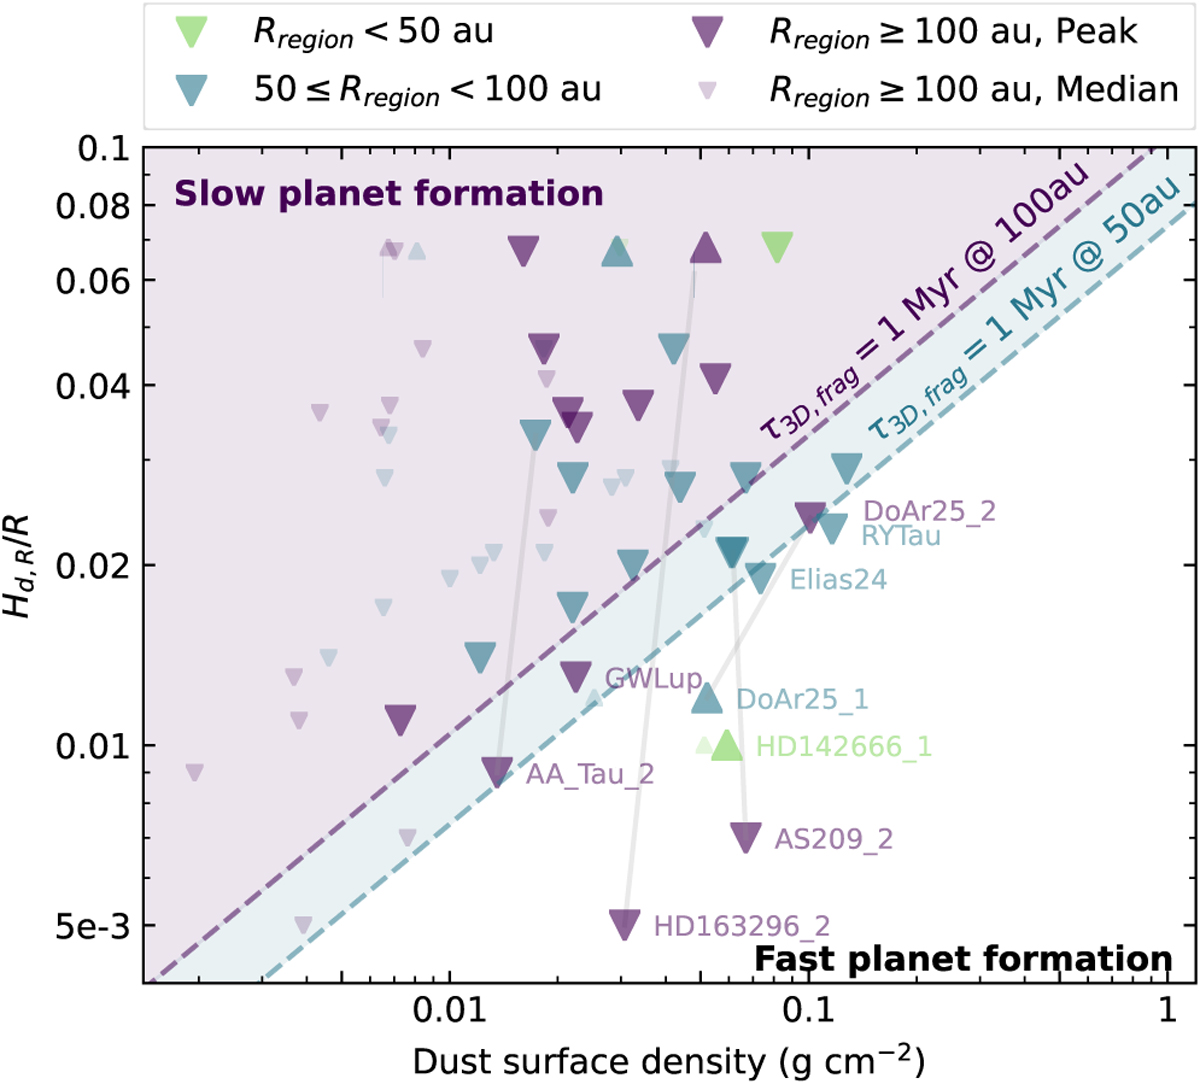
Critical dust surface density for core formation by pebble accretion as function of the solid surface density. Large and small symbols indicate, respectively, the peak and median dust surface density for each of the modeled disk regions, while upper- and lower-limits on the dust disk aspect ratios are indicated by, respectively, downward and upward triangles. The ring location is color-coded according to orbital distance (see legend). The gray lines connecting triangles highlight two regions within the same disk. The figure area below the dashed green line marks rapid core growth timescales: below 1 Myr at 50 au in the 3 D pebble accretion regime, assuming fragmentation-limited pebbles (see Sect. 7). The dashed purple line illustrates the 1-Myr-core-growth timescale at 100 au. Disk regions with aspect ratios in the shaded purple region are unlikely to form planetary cores within disk lifetimes.
Current usage metrics show cumulative count of Article Views (full-text article views including HTML views, PDF and ePub downloads, according to the available data) and Abstracts Views on Vision4Press platform.
Data correspond to usage on the plateform after 2015. The current usage metrics is available 48-96 hours after online publication and is updated daily on week days.
Initial download of the metrics may take a while.