Fig. 2
Download original image
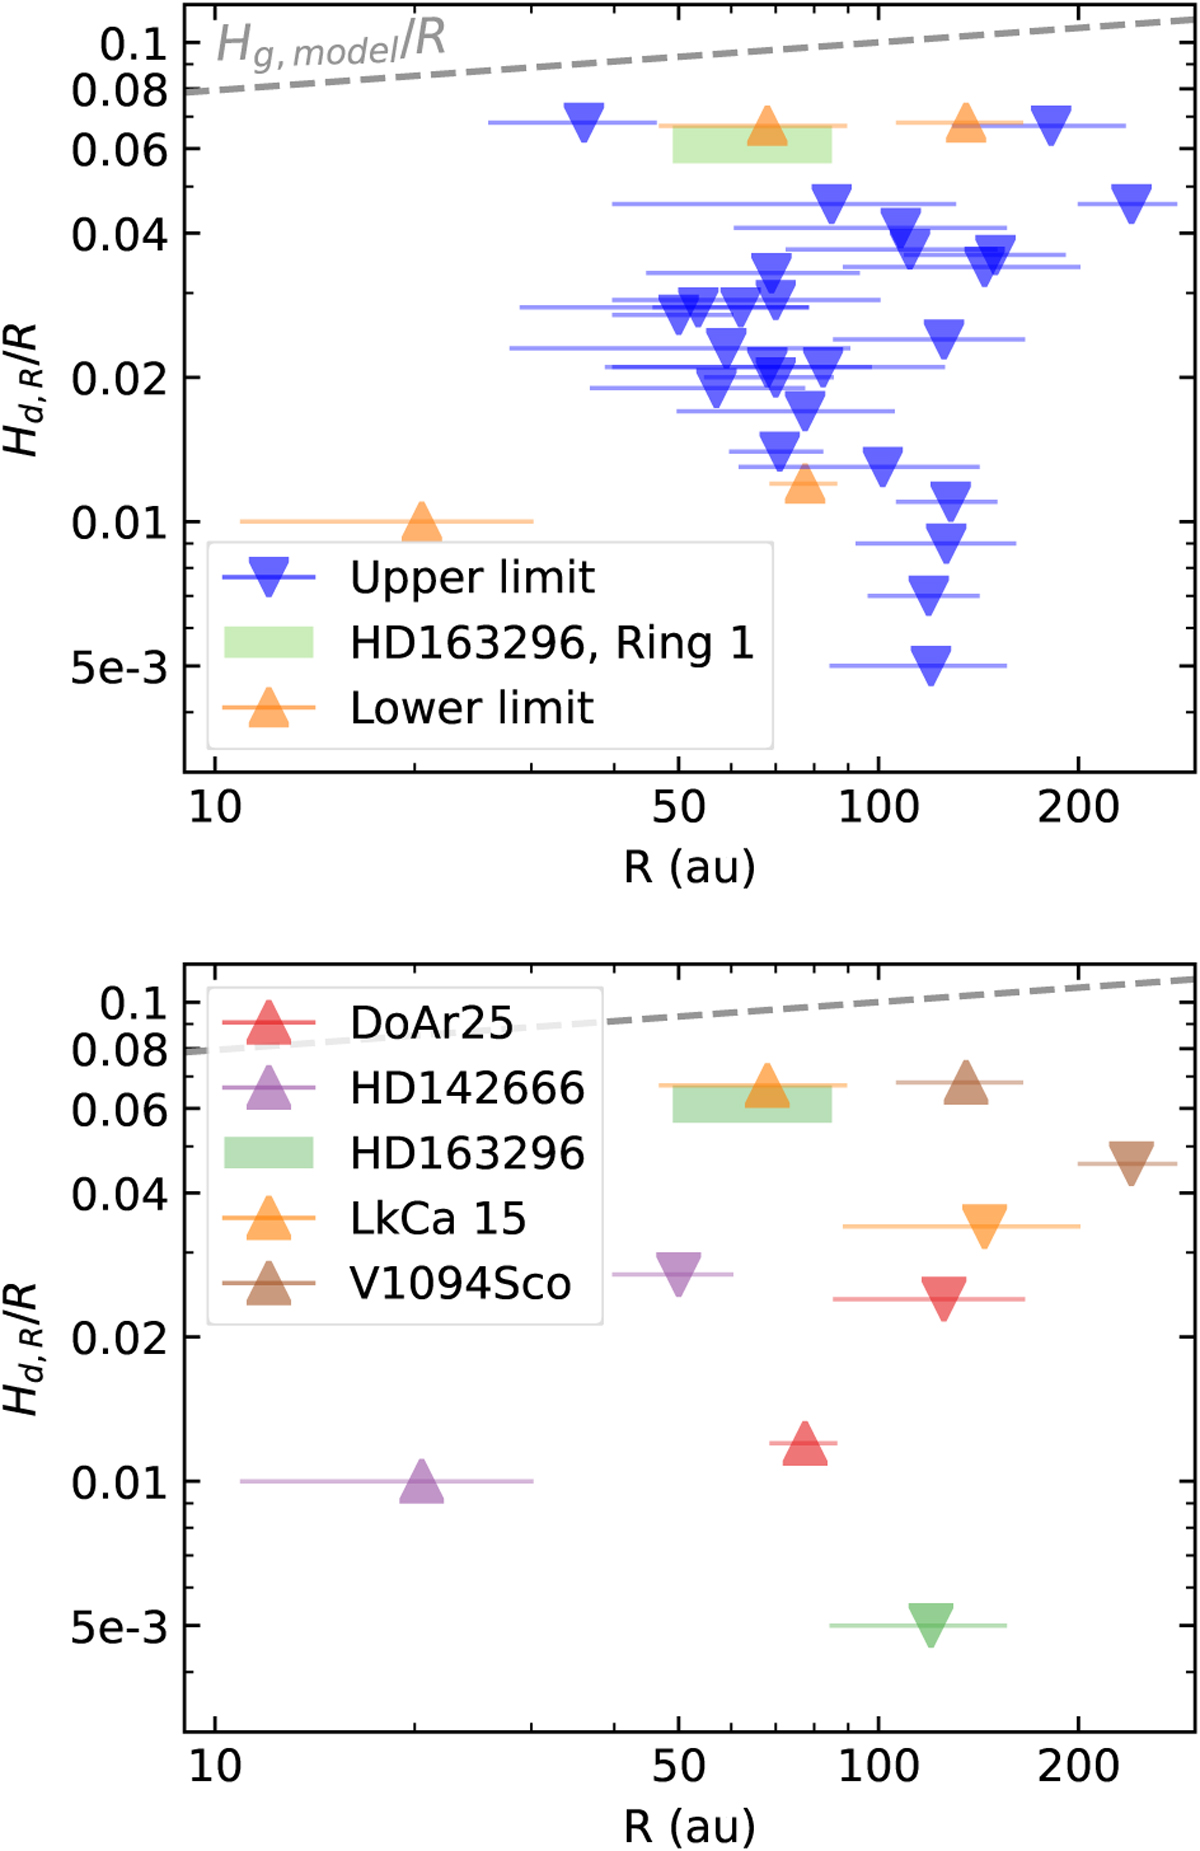
Constraints on the vertical concentration of dust as a function of radius. Each symbol is associated with an horizontal bar corresponding to the range of radii over which the constraint was obtained. The gas scale height assumed in the modeling (Equation (1)) is indicated as a dashed gray line. Top: all disks. Bottom: five systems with both lower and upper limits on their dust height.
Current usage metrics show cumulative count of Article Views (full-text article views including HTML views, PDF and ePub downloads, according to the available data) and Abstracts Views on Vision4Press platform.
Data correspond to usage on the plateform after 2015. The current usage metrics is available 48-96 hours after online publication and is updated daily on week days.
Initial download of the metrics may take a while.