Fig. D.2
Download original image
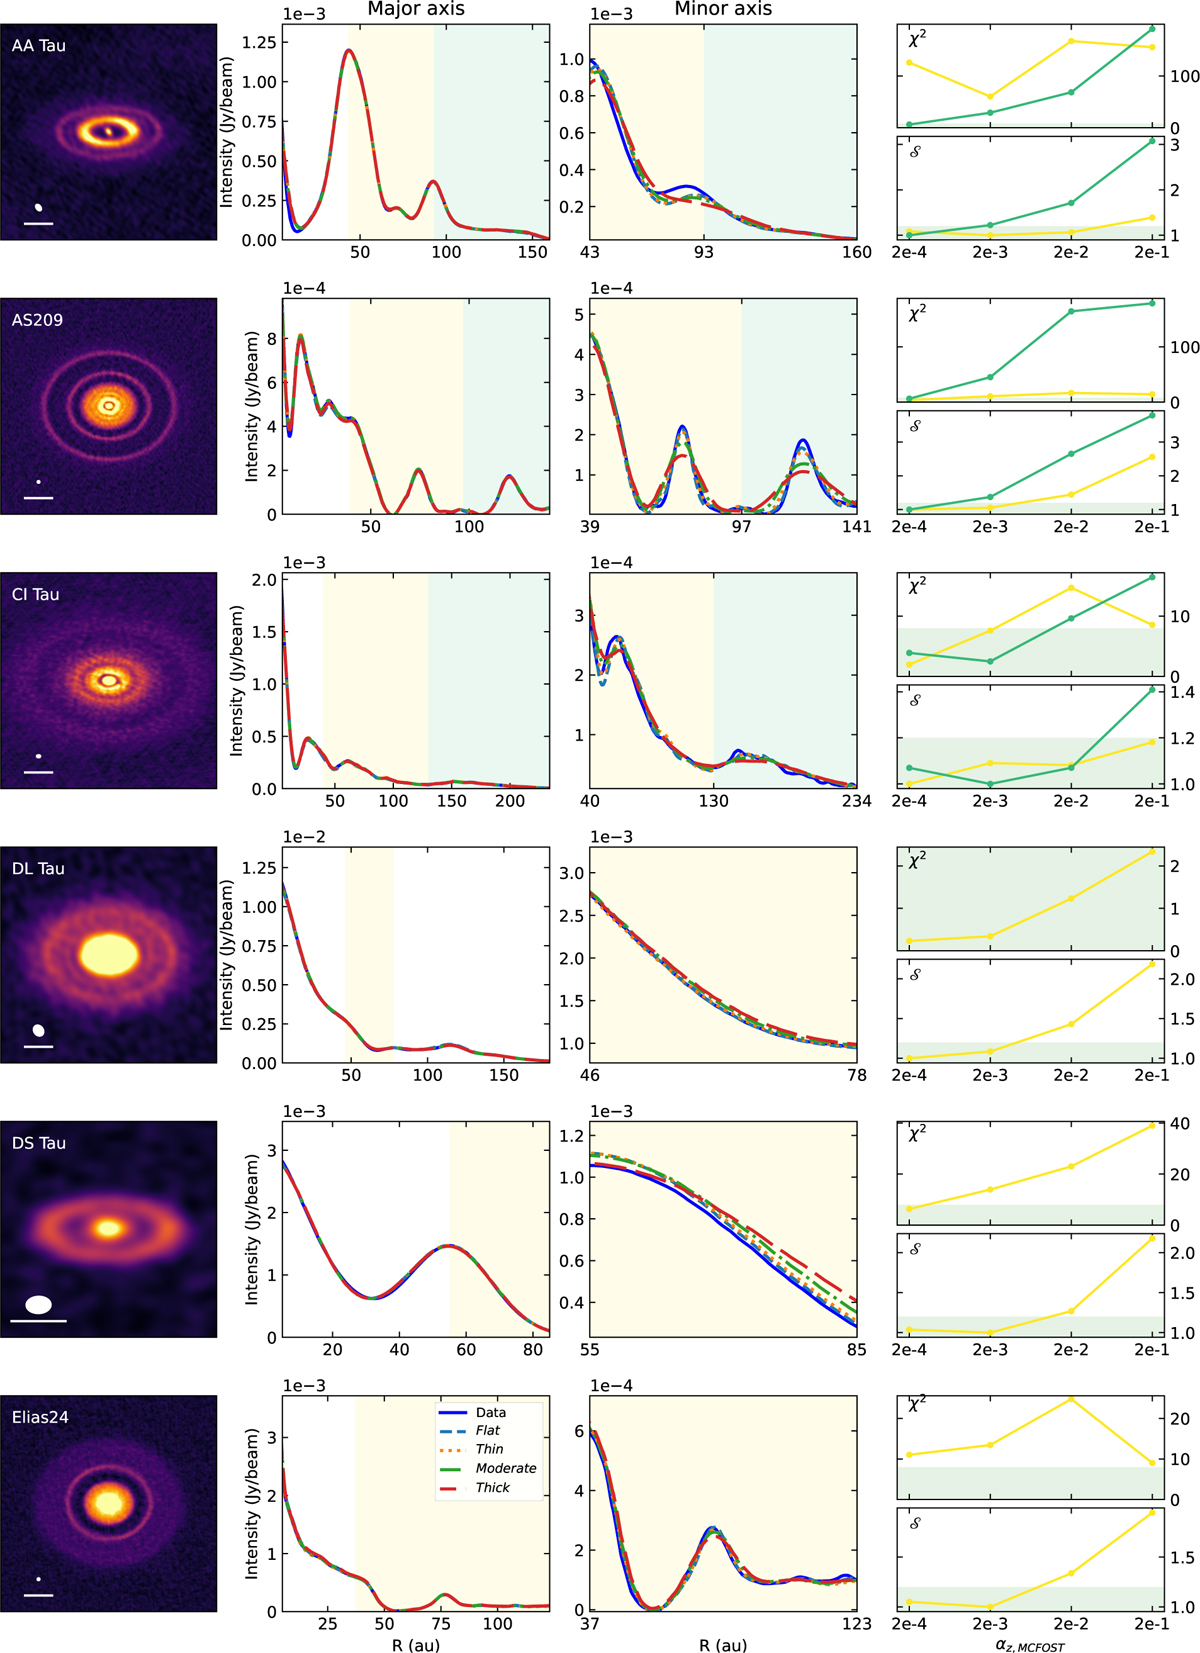
Left: Data image, Middle left: Major axis profiles of the data and models outside of 5au. Middle right: Profiles along an azimuth of the data and model, zoomed in the constrained region. Right: Values for the normalized χ2 (top) and shape parameter 𝒮 (bottom), introduced in Sect. 3.4, quantifying the quality of the models. The green regions indicate that the models are generally good models. The colors of the curves correspond to the similarly colored range of radius in the major axis profile displayed in the second left panel. The beam size and a 25 au scale are indicated in the bottom left corner of the first panels.
Current usage metrics show cumulative count of Article Views (full-text article views including HTML views, PDF and ePub downloads, according to the available data) and Abstracts Views on Vision4Press platform.
Data correspond to usage on the plateform after 2015. The current usage metrics is available 48-96 hours after online publication and is updated daily on week days.
Initial download of the metrics may take a while.