Fig. 3.
Download original image
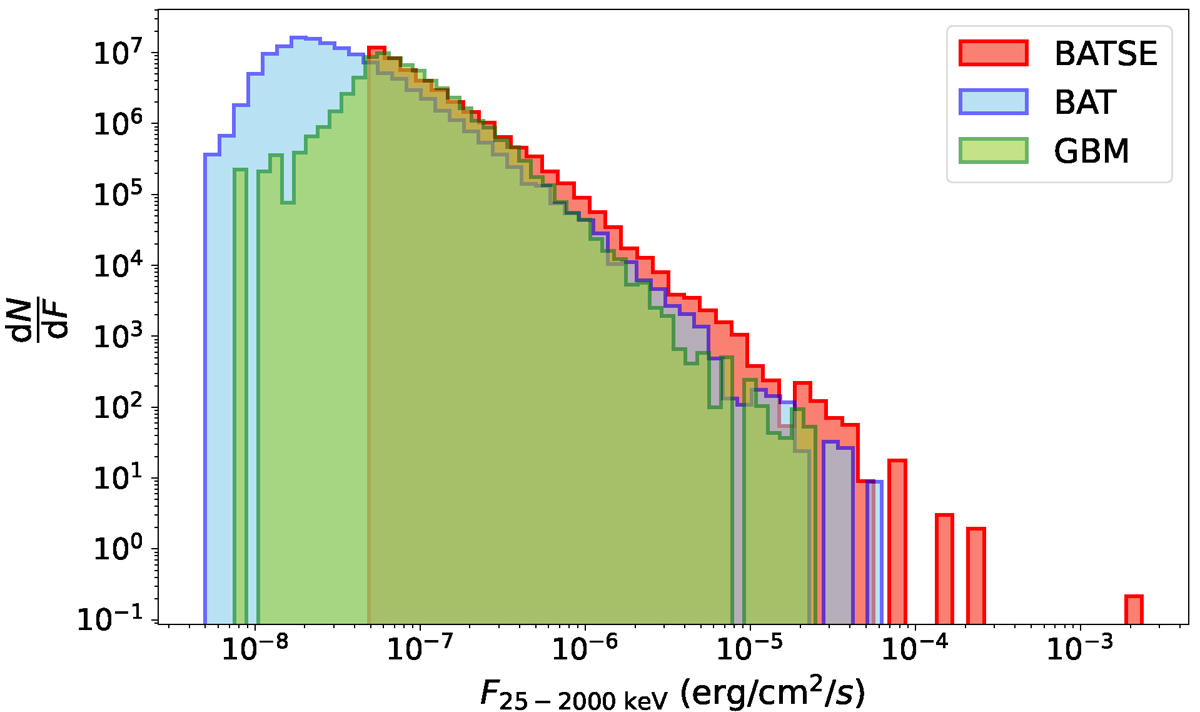
Comparison between the simulated peak flux distributions of the BATSE, Swift, and Fermi samples. Values were rescaled in the BATSE energy passband (25–2000 keV). The sharp drop in the low-tail distribution of BATSE simply reflects the optimal value of the minimum peak flux Fmin obtained with the GA, whereas the same drop for the other two sets was smeared out by the rescaling in the BATSE passband.
Current usage metrics show cumulative count of Article Views (full-text article views including HTML views, PDF and ePub downloads, according to the available data) and Abstracts Views on Vision4Press platform.
Data correspond to usage on the plateform after 2015. The current usage metrics is available 48-96 hours after online publication and is updated daily on week days.
Initial download of the metrics may take a while.