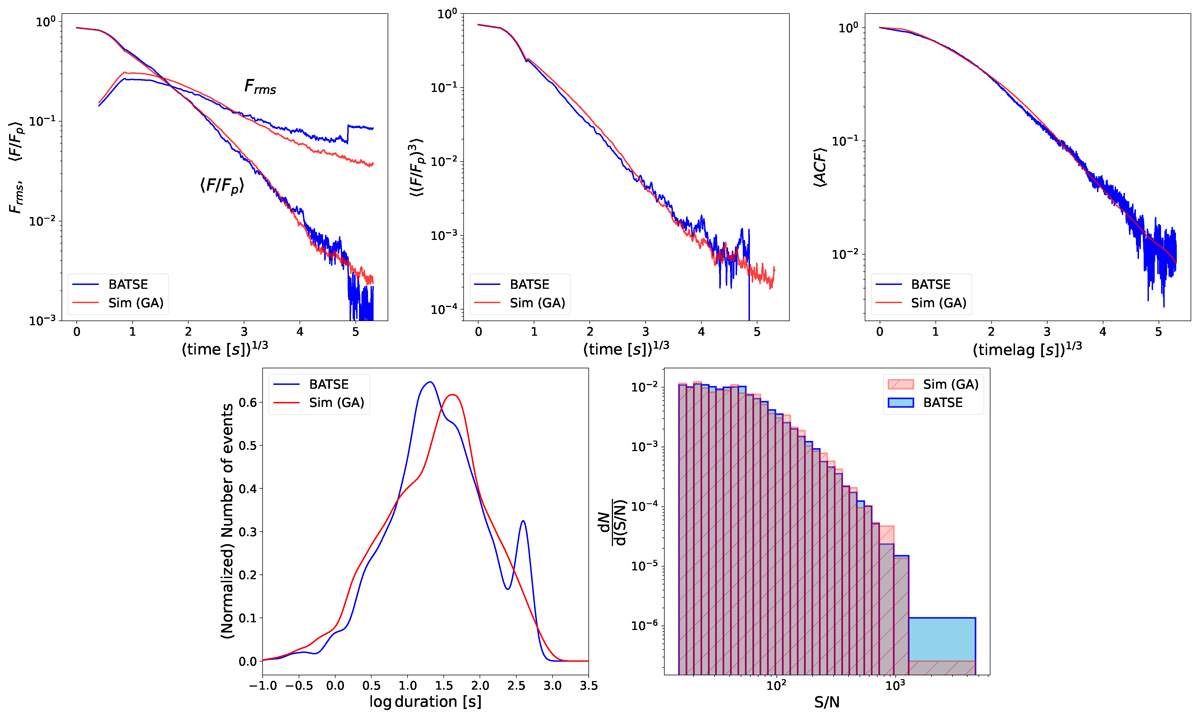
Fig. 2.
Download original image
Distributions of the five metrics for real BATSE light curves (blue) and simulated profiles (red) obtained using the latest optimised parameter set (see Table 2). Top left: average peak-aligned post-peak normalised time profile and root mean square (rms) deviation of the individual peak-aligned profiles, Frms ≡ [⟨(F/Fp)2⟩−⟨F/Fp⟩2]1/2. Top middle: average peak-aligned third moment profiles. Top left: average autocorrelation function of the GRBs. Bottom left: distribution of the T20% duration. Bottom right: S/N distribution of the GRBs. Like in B24, the curves in the top left and top middle panels were smoothed using a Savitzky-Golay filter to reduce the effects of Poisson noise, while the distributions in the bottom left panel were smoothed with a Gaussian kernel convolution.
Current usage metrics show cumulative count of Article Views (full-text article views including HTML views, PDF and ePub downloads, according to the available data) and Abstracts Views on Vision4Press platform.
Data correspond to usage on the plateform after 2015. The current usage metrics is available 48-96 hours after online publication and is updated daily on week days.
Initial download of the metrics may take a while.