Fig. 9.
Download original image
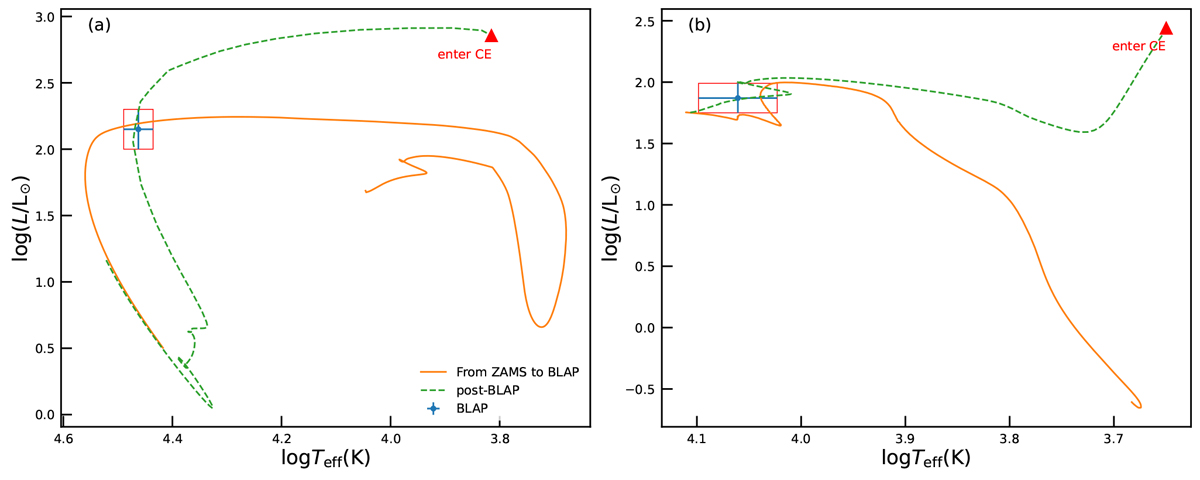
Complete evolutionary tracks for both components in the binary system from the ZAMS through the BLAP phase and their subsequent evolution until the onset of CE. Panel (a): Evolutionary path of the primary star as it transitions from the ZAMS through the BLAP phase (solid orange line) and its subsequent evolution towards the CE phase (dashed green line), with the red triangle marking the point of CE initiation. Panel b: Corresponding evolution of the secondary star, illustrating its evolution until the system enters the CE phase, following the same line style and colour conventions as panel a.
Current usage metrics show cumulative count of Article Views (full-text article views including HTML views, PDF and ePub downloads, according to the available data) and Abstracts Views on Vision4Press platform.
Data correspond to usage on the plateform after 2015. The current usage metrics is available 48-96 hours after online publication and is updated daily on week days.
Initial download of the metrics may take a while.